

Question: I will definitely rate thank you so much A real estate agent in Florida is interested in house prices and in the factors that determine
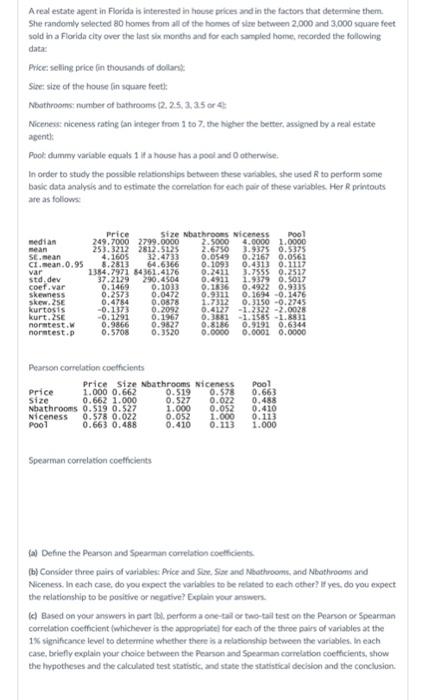
A real estate agent in Florida is interested in house prices and in the factors that determine them. She randomly selected 80 homes from all of the homes of size between 2,000 and 3,000 square feet sold in a Florida city over the last six months and for each sampled home, recorded the following data: Price: selling price (in thousands of dollar Size: size of the house in square feet): Nbathrooms: number of bathrooms (2, 2.5, 3, 3.5 or 4 Nicenes: niceness rating an integer from 1 to 7, the higher the better, assigned by a real estate agent): Pool: dummy variable equals 1 if a house has a pool and 0 otherwise In order to study the possible relationships between these variables, she used R to perform some basic data analysis and to estimate the correlation for each pair of these variables. Her R printouts are as follows: Pool median Price 249.7000 2799.0000 253.3212 2812.5125 mean SE mean CI.mean.0.95 4.1605 32.4733 0.0549 8.2813 64.6366 0.1093 1384.7971 84361.4176 0.2411 var std.dev coef var 37.2129 290.4504 Size Nbathrooms Niceness 2.5000 4.0000 1.0000 2.6750 3.9375 0.5375 0.2167 0.0561 0.4313 0.1117 3.7555 0.2517 1.9379 0.5017 0.4922 0.9335 0.9311 0.1694 -0.1476 1.7312 0.3150 -0.2745 0.4127 -1.2322 -2.0028 0.3881 -1.1585-1.8831 0.4911 0.1469 0.1033 0.1836 skewness 0.2573 0.0472 0.4784 0.0878 skew.25E kurtosis kurt.25E -0.1373 0.2092 -0.1291 0.1967 0.9866 0.9827 0.5708 0.3520 normtest.w 0.8186 0.9191 0.6344 0.0000 0.0001 0.0000 normtest.p Pearson correlation coefficients Price Size Nbathrooms Niceness Pool Price 1.000 0.662 0.519 0.578 0.663 size 0.662 1.000 0.527 0.022 0.488 Nbathrooms 0.519 0.527 1.000 0.052 0.410 0.578 0.022 1.000 0.113 Niceness Pool 0.663 0.488 0.052 0.410 0.113 1.000 Spearman correlation coefficients (a) Define the Pearson and Spearman correlation coefficients (b) Consider three pairs of variables: Price and Sine. Size and Nbathrooms, and Nbathrooms and Niceness. In each case, do you expect the variables to be related to each other? If yes, do you expect the relationship to be positive or negative? Explain your answers. (c) Based on your answers in part (bl. perform a one-tail or two-tail test on the Pearson or Spearman correlation coefficient (whichever is the appropriate for each of the three pairs of variables at the 1% significance level to determine whether there is a relationship between the variables. In each case, briefly explain your choice between the Pearson and Spearman correlation coefficients, show the hypotheses and the calculated test statistic, and state the statistical decision and the conclusion. A real estate agent in Florida is interested in house prices and in the factors that determine them. She randomly selected 80 homes from all of the homes of size between 2,000 and 3,000 square feet sold in a Florida city over the last six months and for each sampled home, recorded the following data: Price: selling price (in thousands of dollar Size: size of the house in square feet): Nbathrooms: number of bathrooms (2, 2.5, 3, 3.5 or 4 Nicenes: niceness rating an integer from 1 to 7, the higher the better, assigned by a real estate agent): Pool: dummy variable equals 1 if a house has a pool and 0 otherwise In order to study the possible relationships between these variables, she used R to perform some basic data analysis and to estimate the correlation for each pair of these variables. Her R printouts are as follows: Pool median Price 249.7000 2799.0000 253.3212 2812.5125 mean SE mean CI.mean.0.95 4.1605 32.4733 0.0549 8.2813 64.6366 0.1093 1384.7971 84361.4176 0.2411 var std.dev coef var 37.2129 290.4504 Size Nbathrooms Niceness 2.5000 4.0000 1.0000 2.6750 3.9375 0.5375 0.2167 0.0561 0.4313 0.1117 3.7555 0.2517 1.9379 0.5017 0.4922 0.9335 0.9311 0.1694 -0.1476 1.7312 0.3150 -0.2745 0.4127 -1.2322 -2.0028 0.3881 -1.1585-1.8831 0.4911 0.1469 0.1033 0.1836 skewness 0.2573 0.0472 0.4784 0.0878 skew.25E kurtosis kurt.25E -0.1373 0.2092 -0.1291 0.1967 0.9866 0.9827 0.5708 0.3520 normtest.w 0.8186 0.9191 0.6344 0.0000 0.0001 0.0000 normtest.p Pearson correlation coefficients Price Size Nbathrooms Niceness Pool Price 1.000 0.662 0.519 0.578 0.663 size 0.662 1.000 0.527 0.022 0.488 Nbathrooms 0.519 0.527 1.000 0.052 0.410 0.578 0.022 1.000 0.113 Niceness Pool 0.663 0.488 0.052 0.410 0.113 1.000 Spearman correlation coefficients (a) Define the Pearson and Spearman correlation coefficients (b) Consider three pairs of variables: Price and Sine. Size and Nbathrooms, and Nbathrooms and Niceness. In each case, do you expect the variables to be related to each other? If yes, do you expect the relationship to be positive or negative? Explain your answers. (c) Based on your answers in part (bl. perform a one-tail or two-tail test on the Pearson or Spearman correlation coefficient (whichever is the appropriate for each of the three pairs of variables at the 1% significance level to determine whether there is a relationship between the variables. In each case, briefly explain your choice between the Pearson and Spearman correlation coefficients, show the hypotheses and the calculated test statistic, and state the statistical decision and the conclusion
Step by Step Solution
There are 3 Steps involved in it

Get step-by-step solutions from verified subject matter experts