Answered step by step
Verified Expert Solution
Question
1 Approved Answer
I will take care of the Executive Summary, I just need help with the Spreadsheet part. Thank you. Spreadsheet Template Preview: Link to Spreadsheet templates
I will take care of the Executive Summary, I just need help with the Spreadsheet part. Thank you.

Spreadsheet Template Preview:
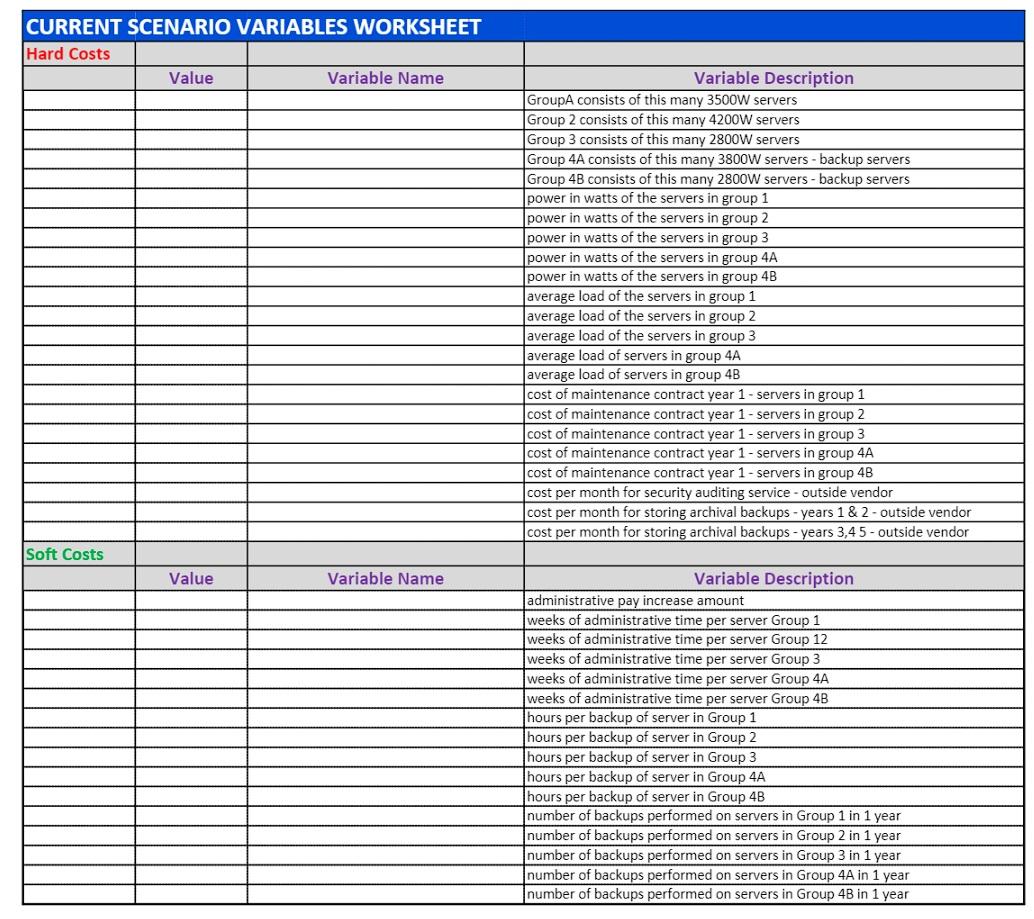
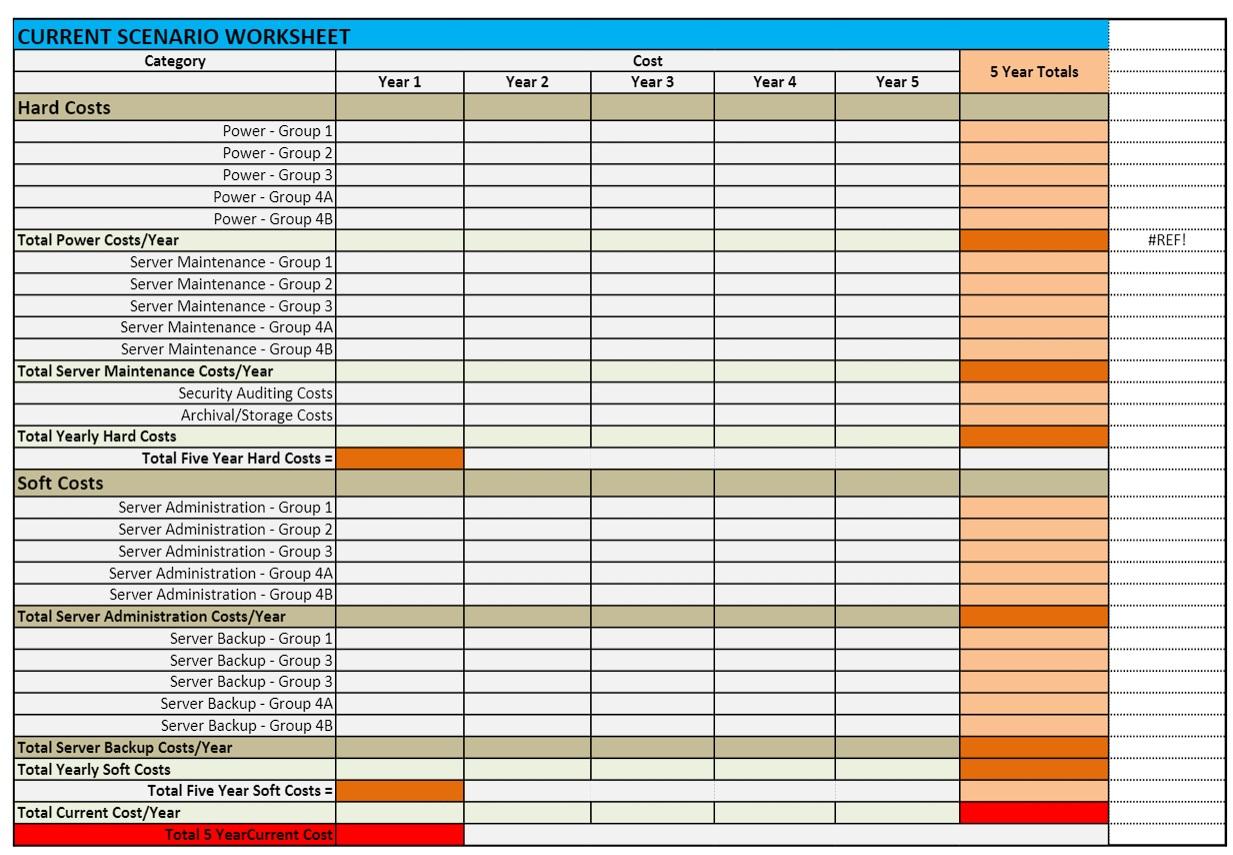
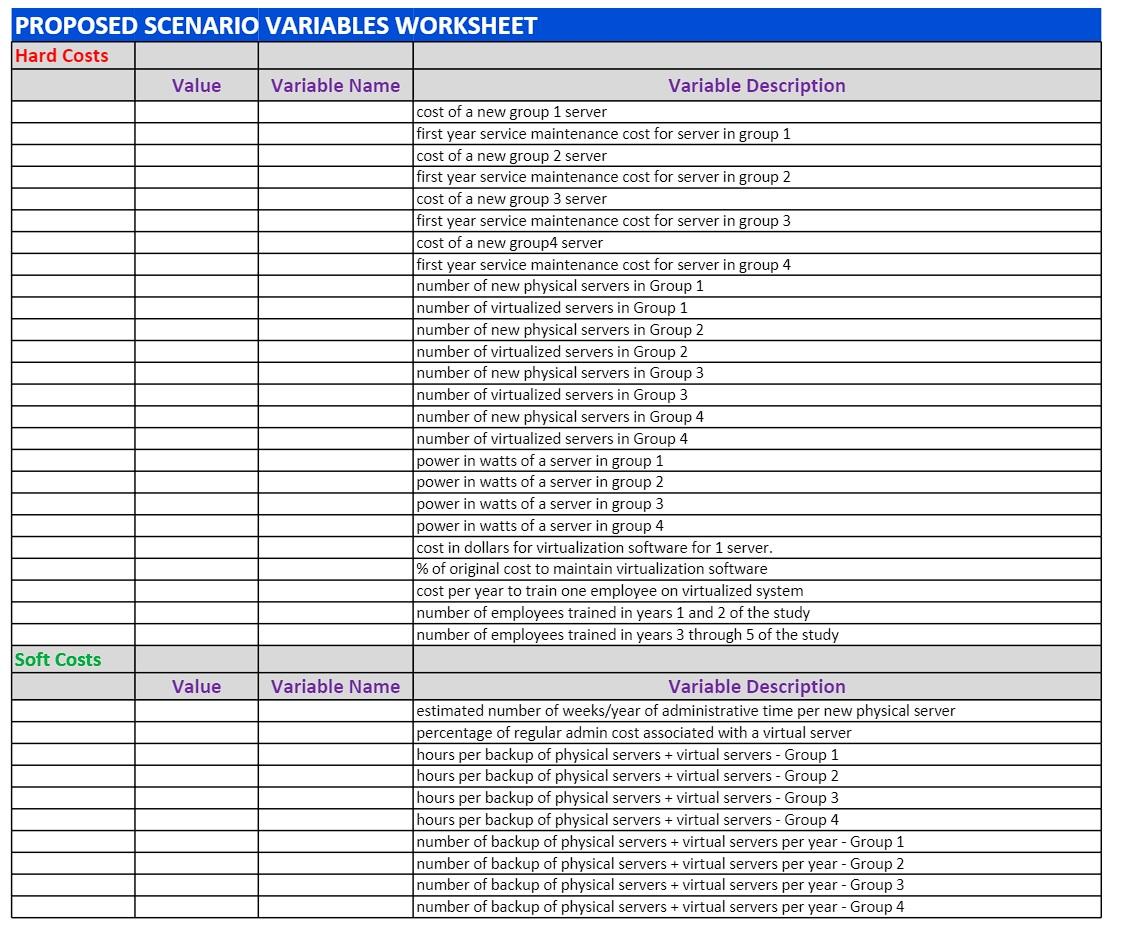
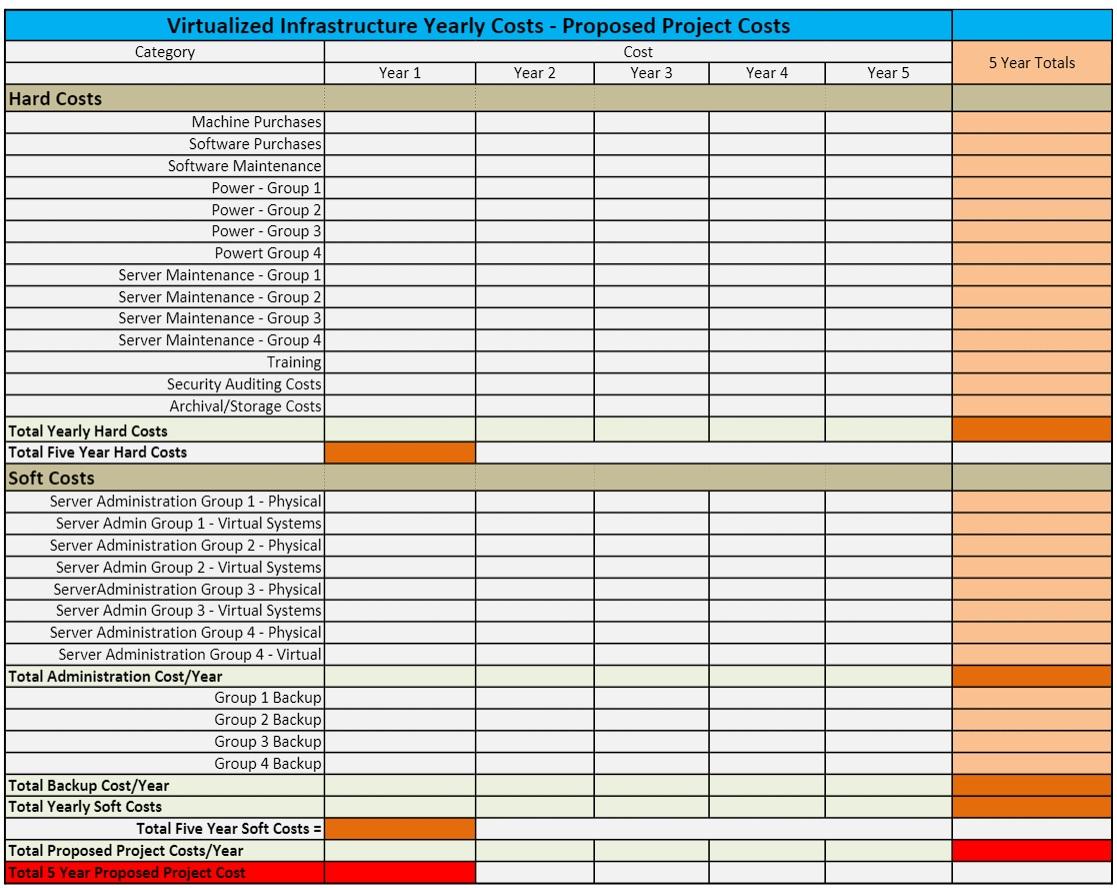
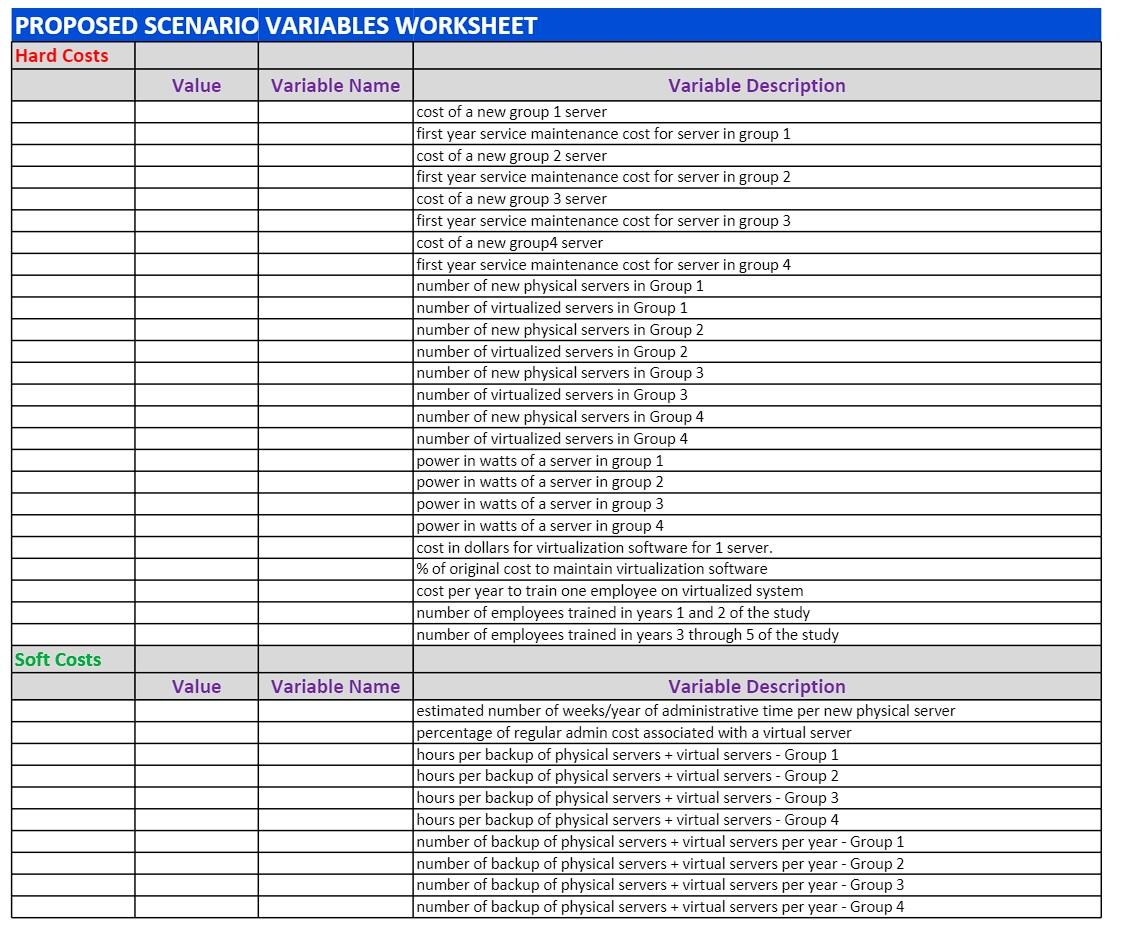
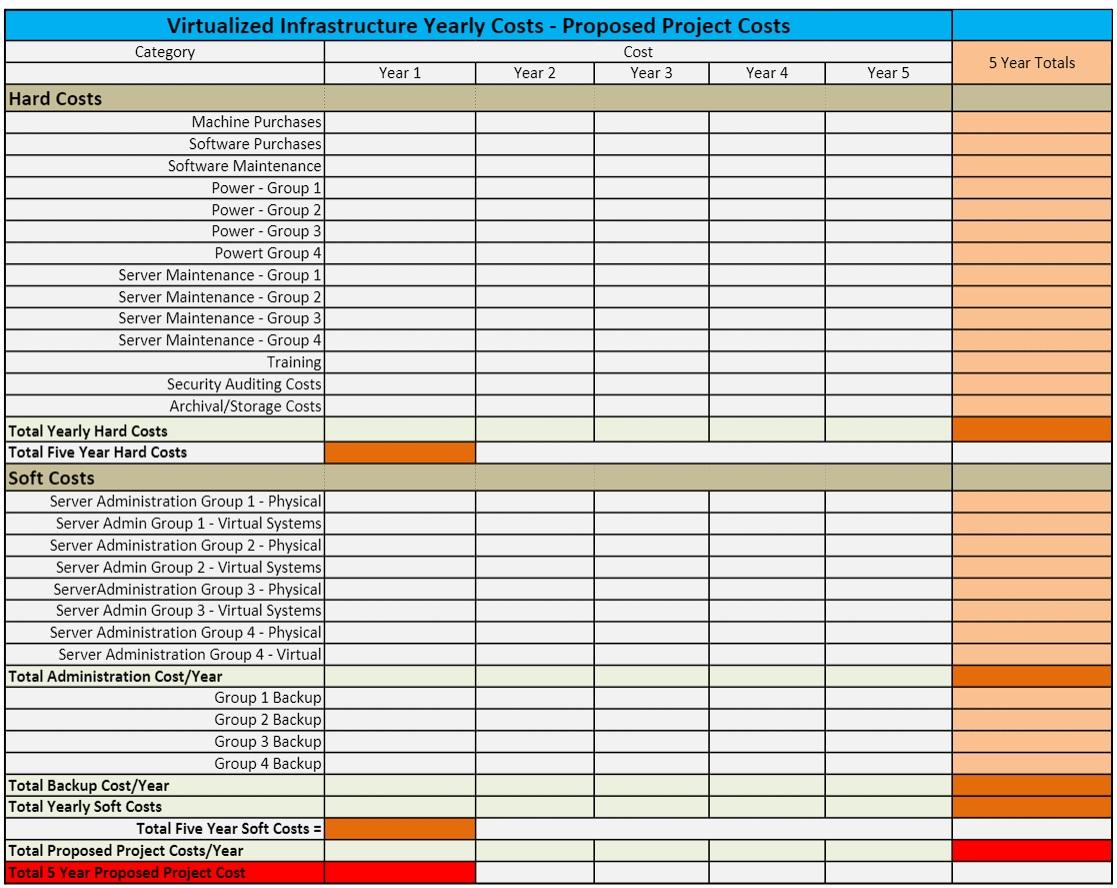
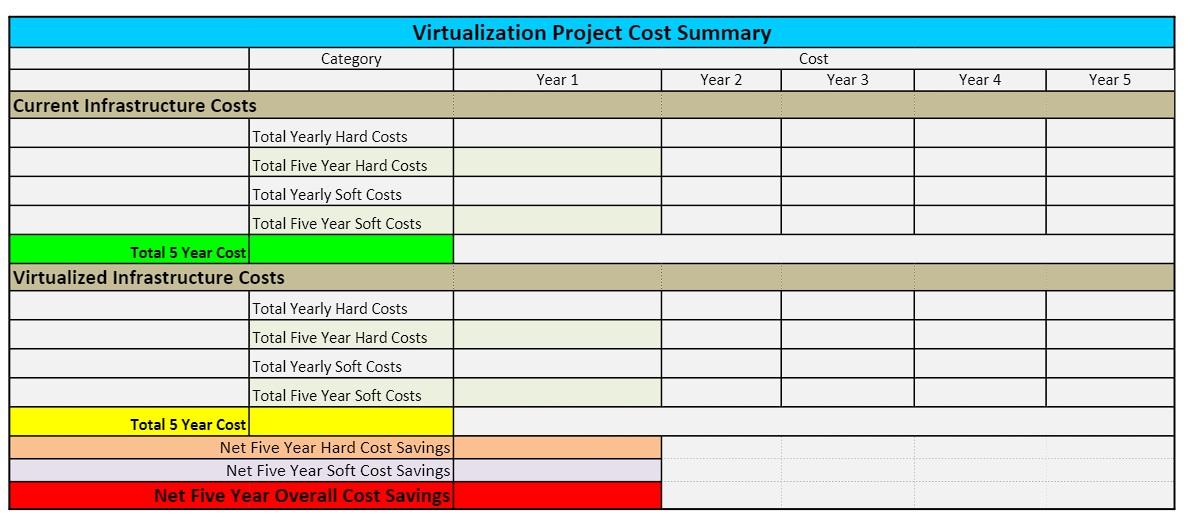
Link to Spreadsheet templates to be used: https://drive.google.com/file/d/14c5LjxPfnccRX9_3Ui49Y0SBRcnJ420U/view?usp=sharing
Please provide some short notes for me on what's happening on the spreadsheet that you made, so that I can make use of those on the Executive Summary. Thank you.
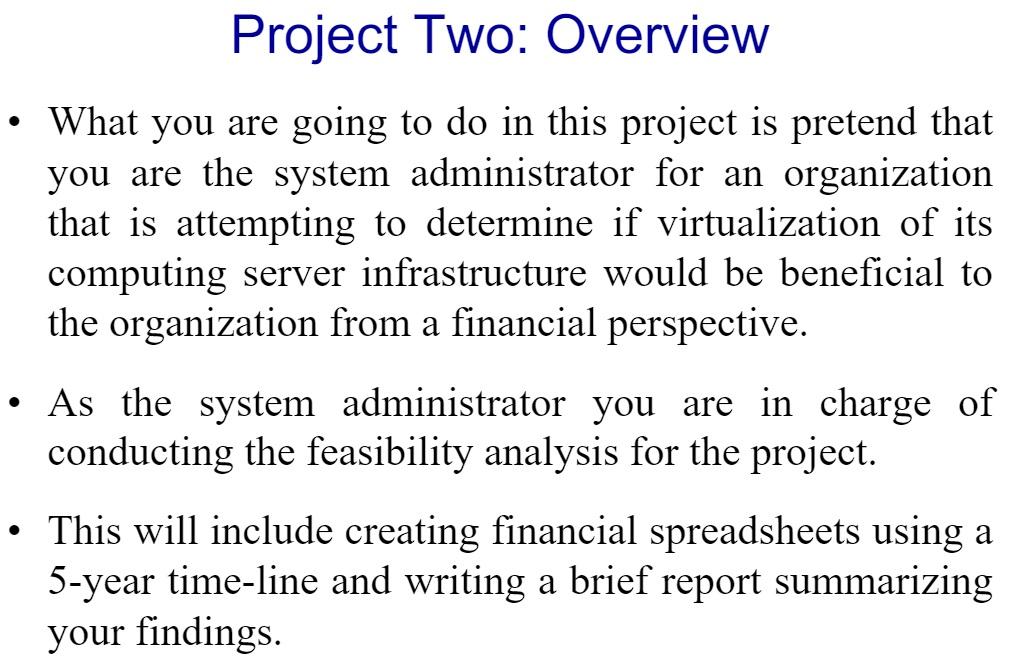
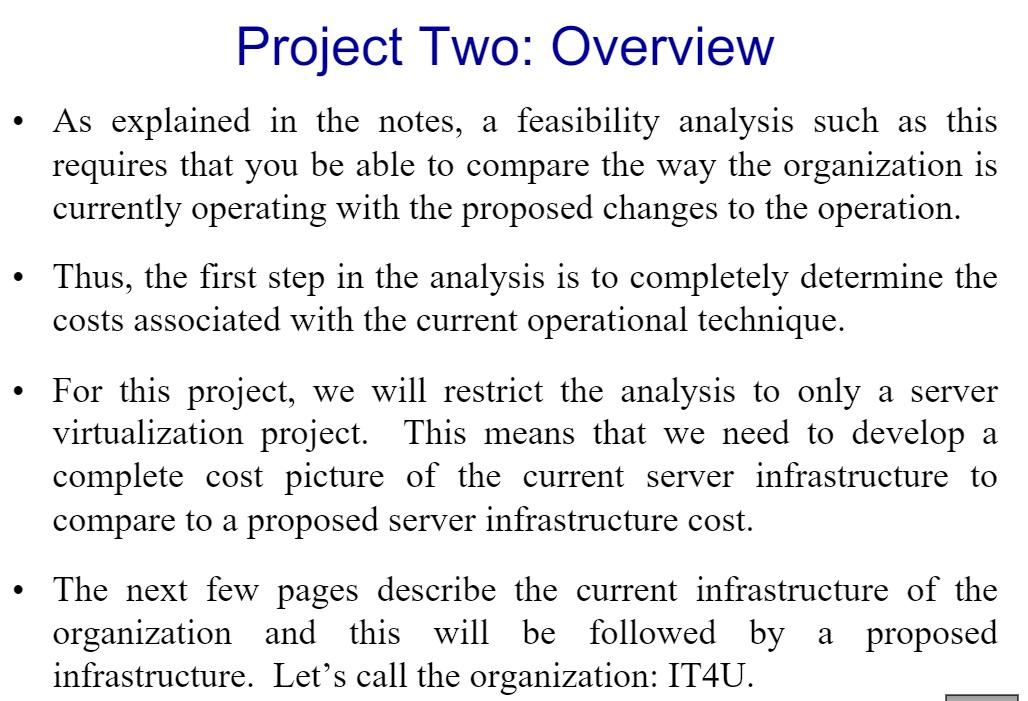
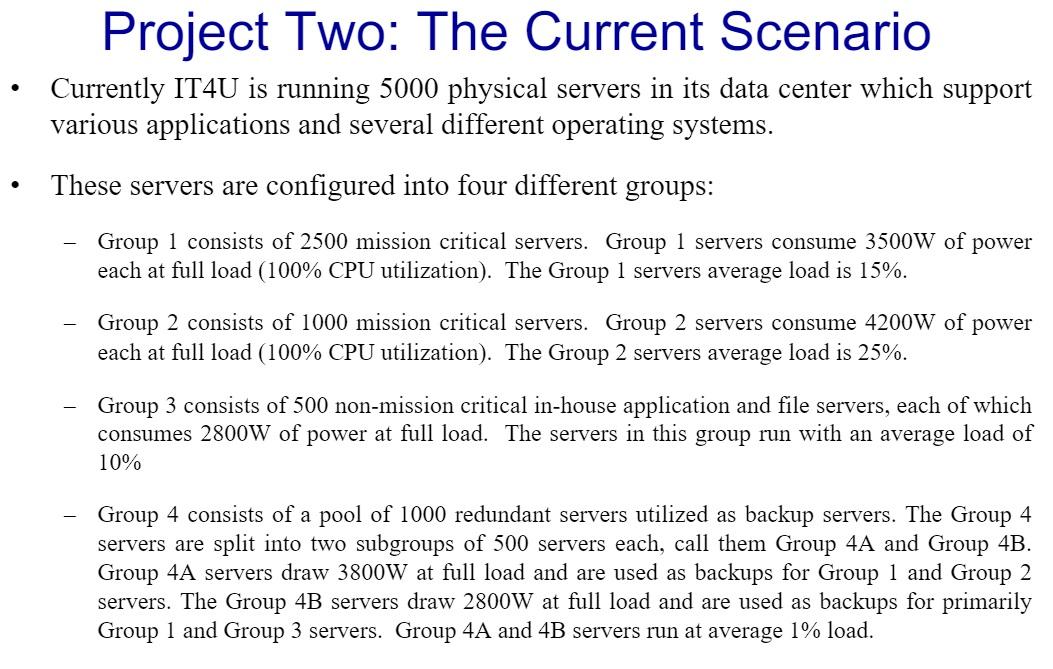
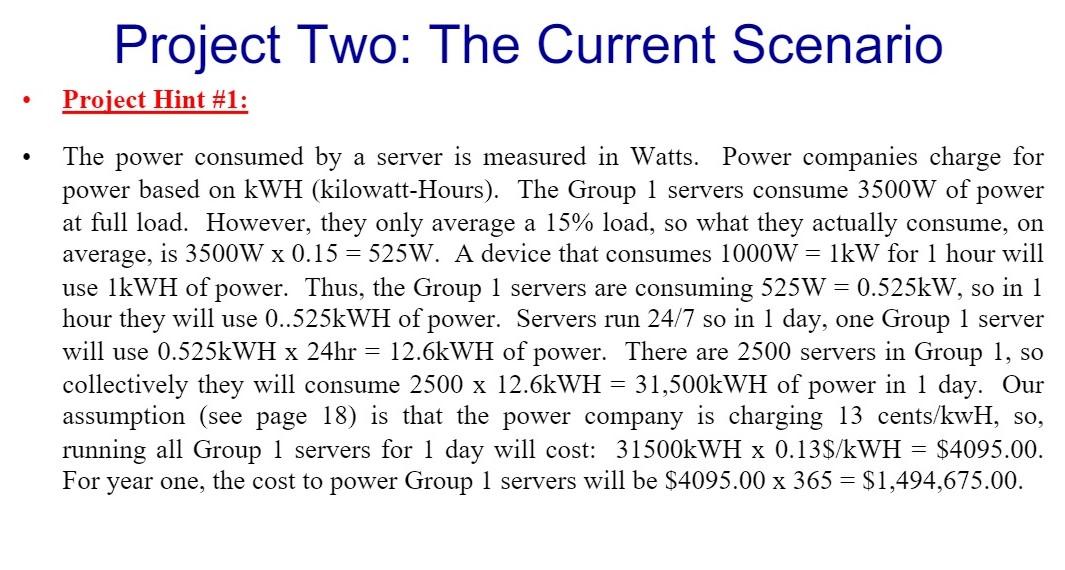
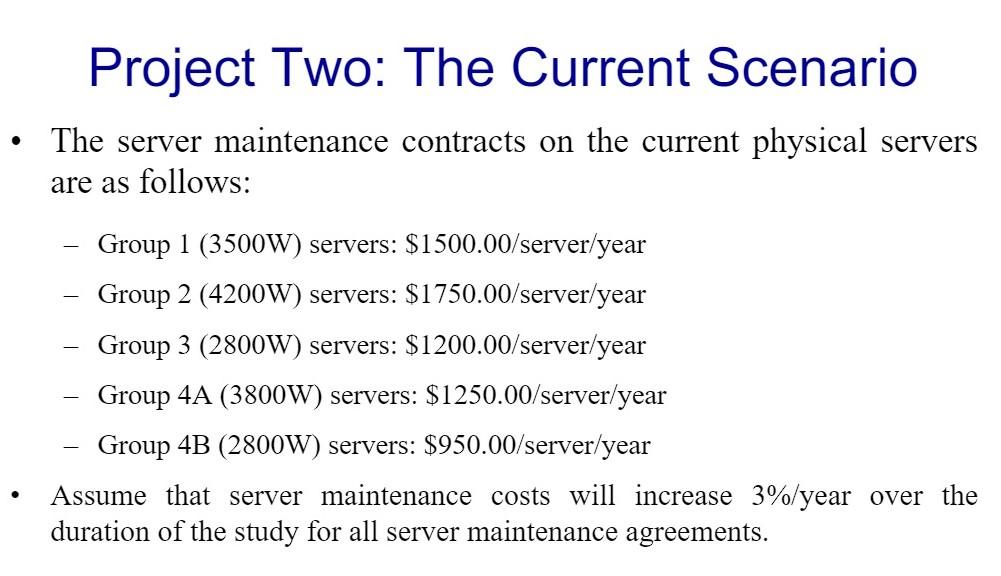
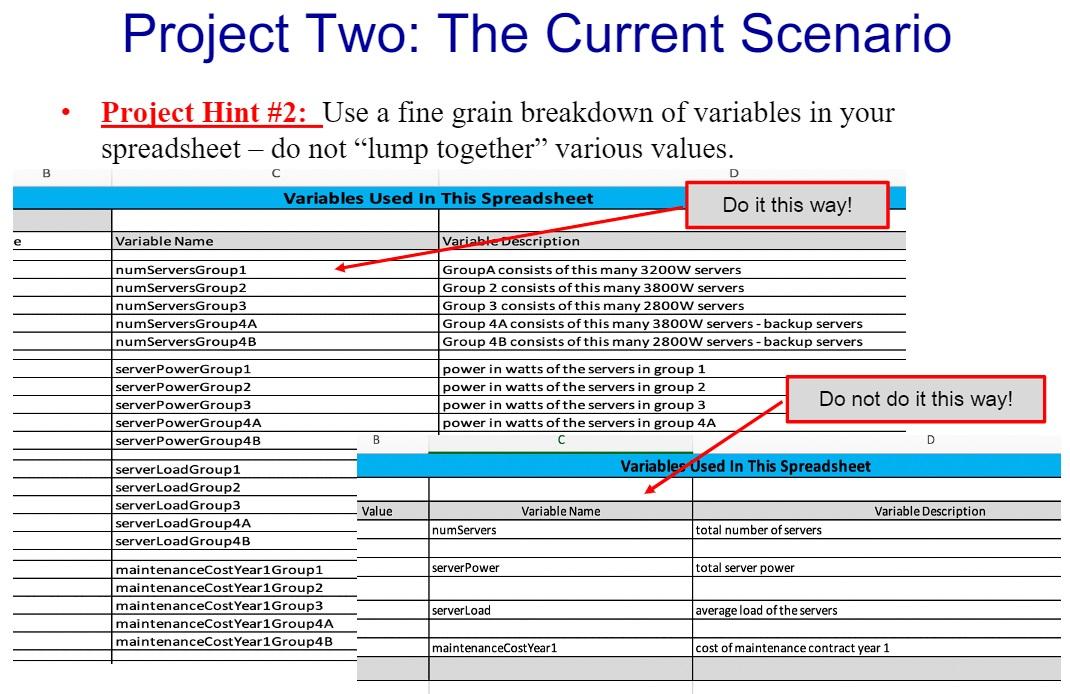
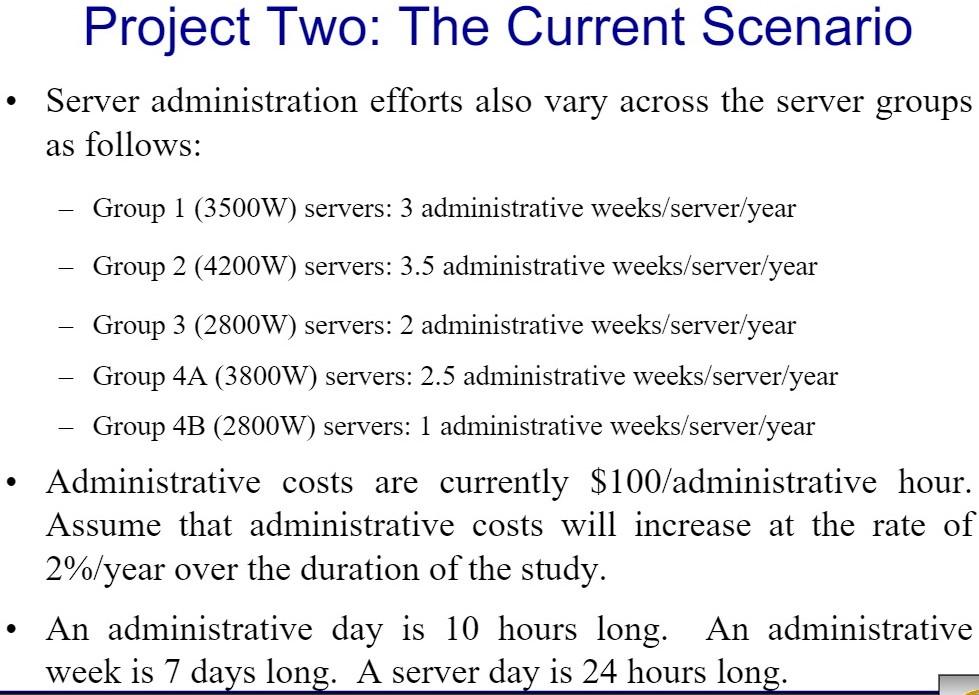
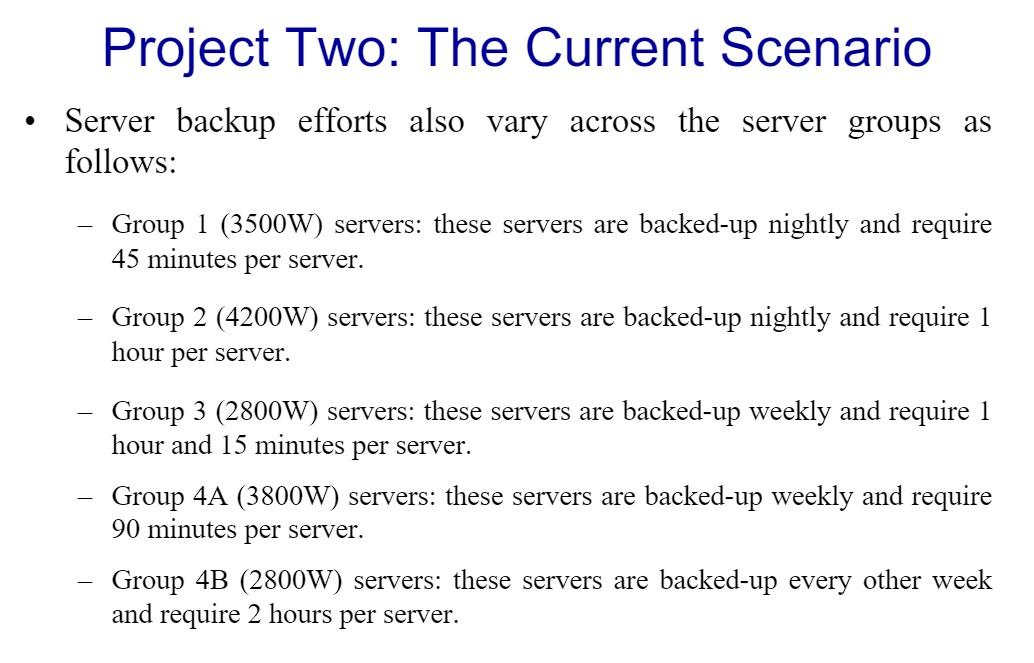
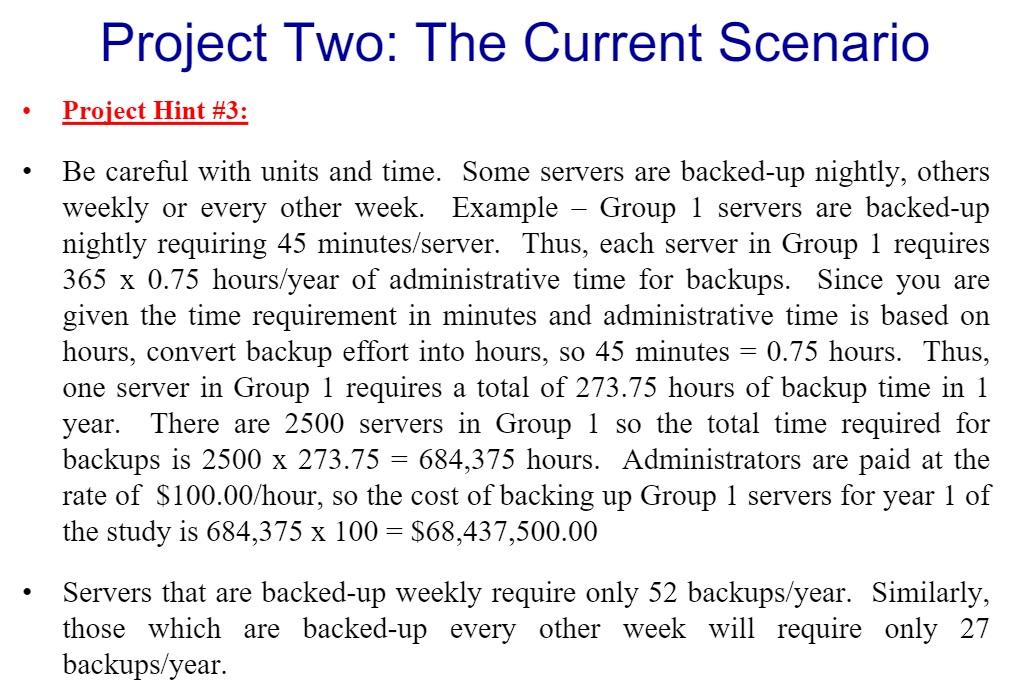
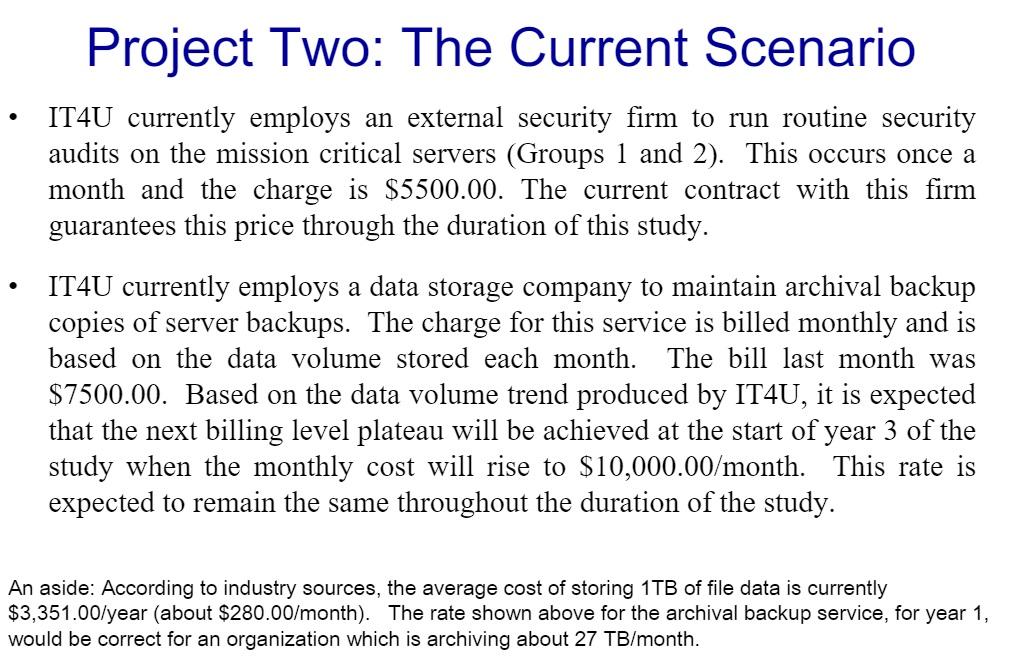
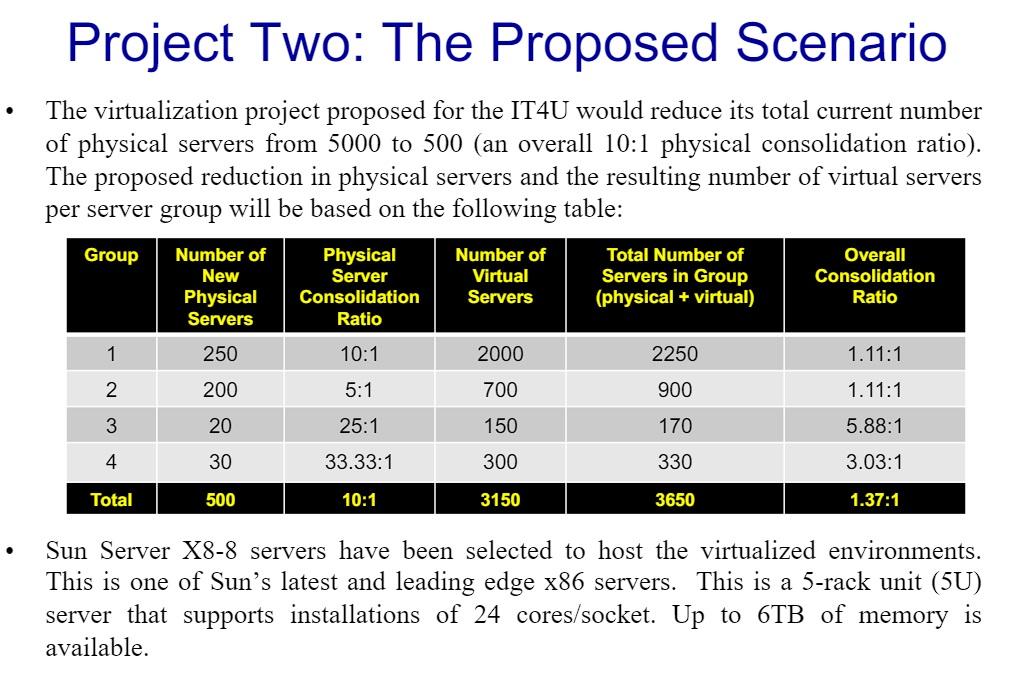
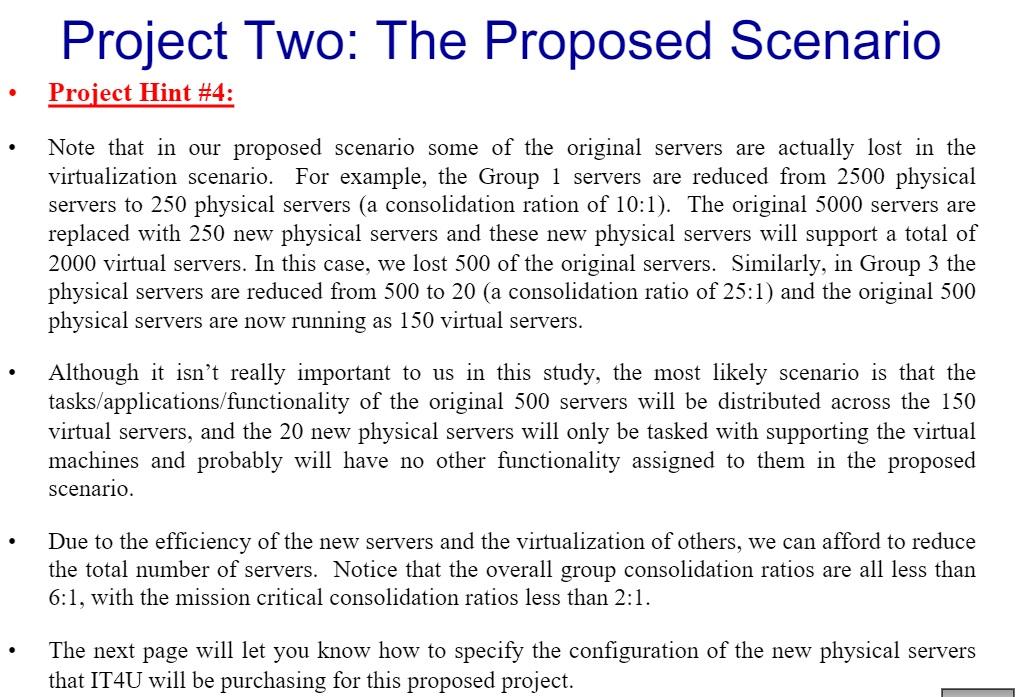
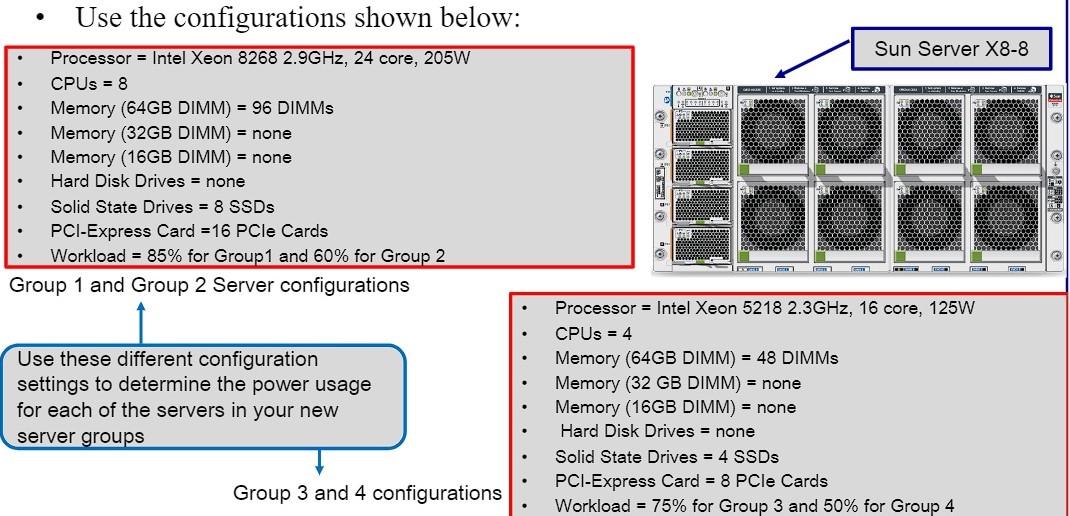
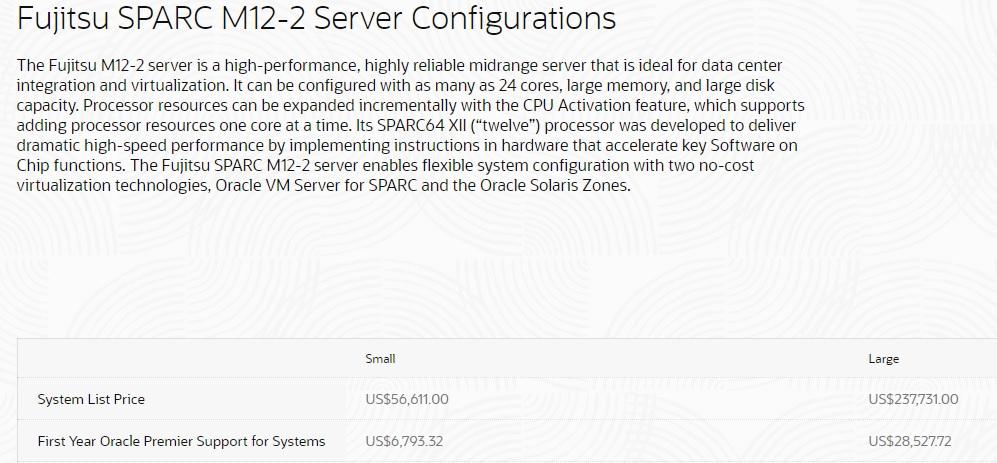
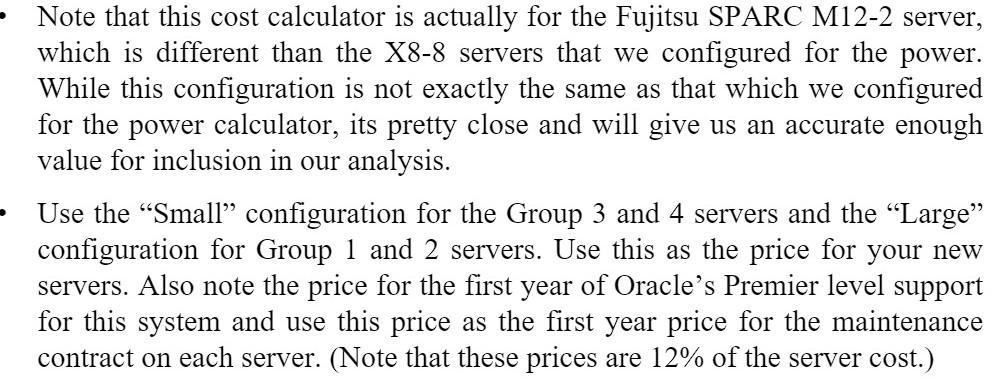
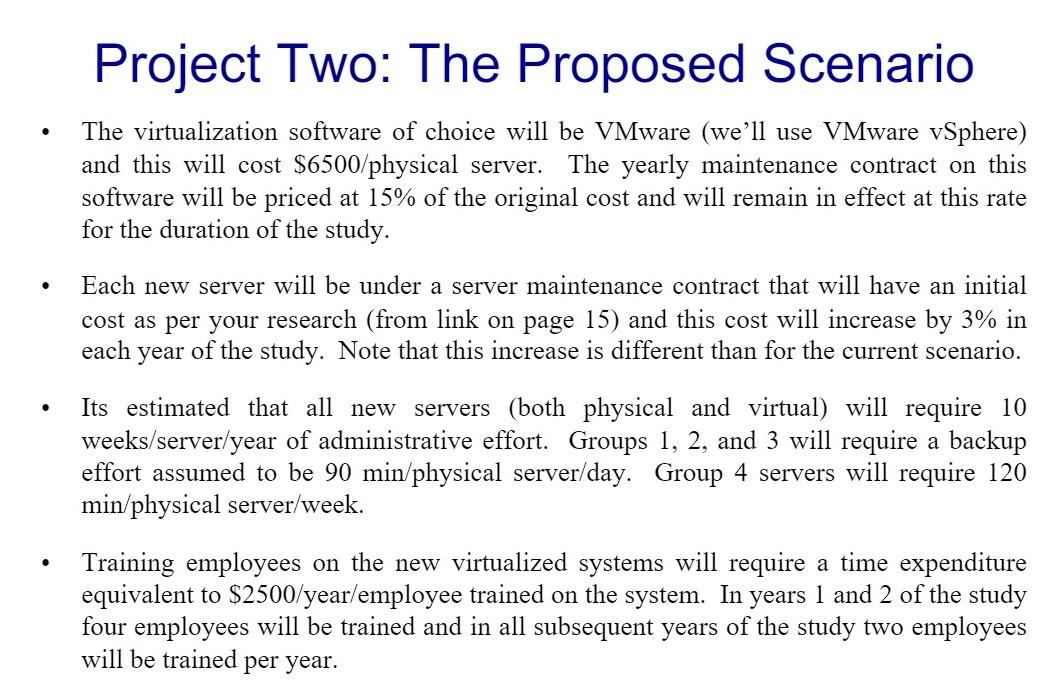
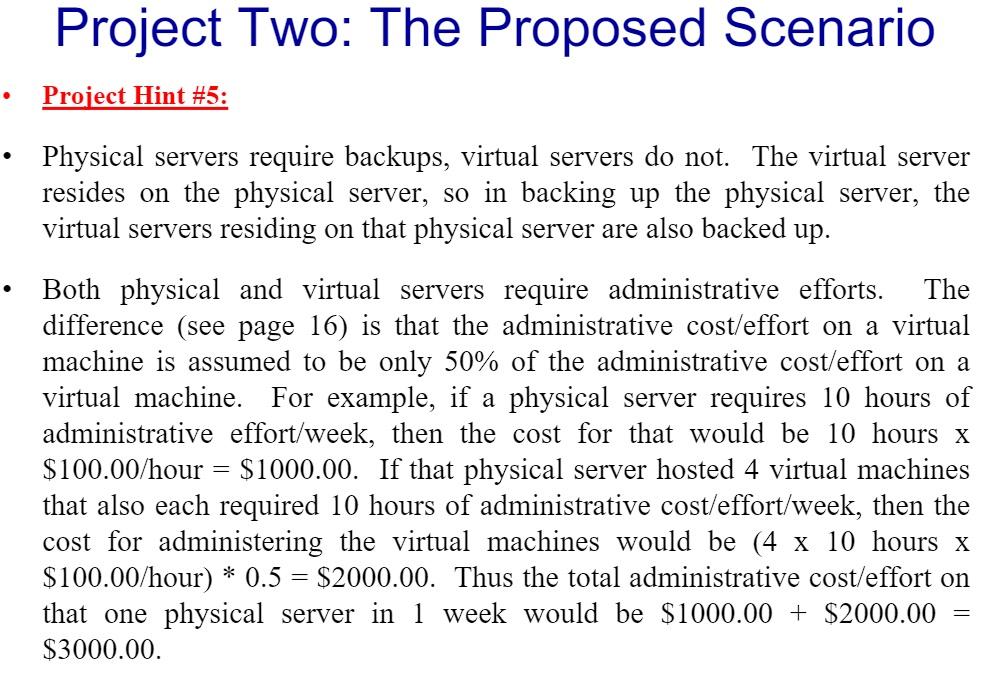
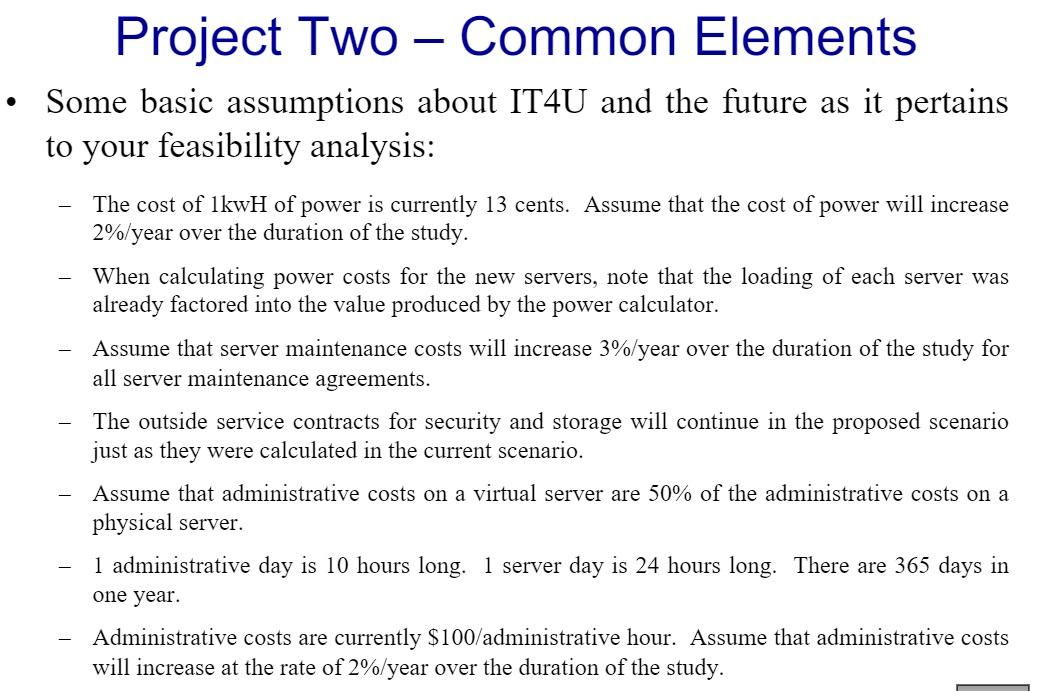
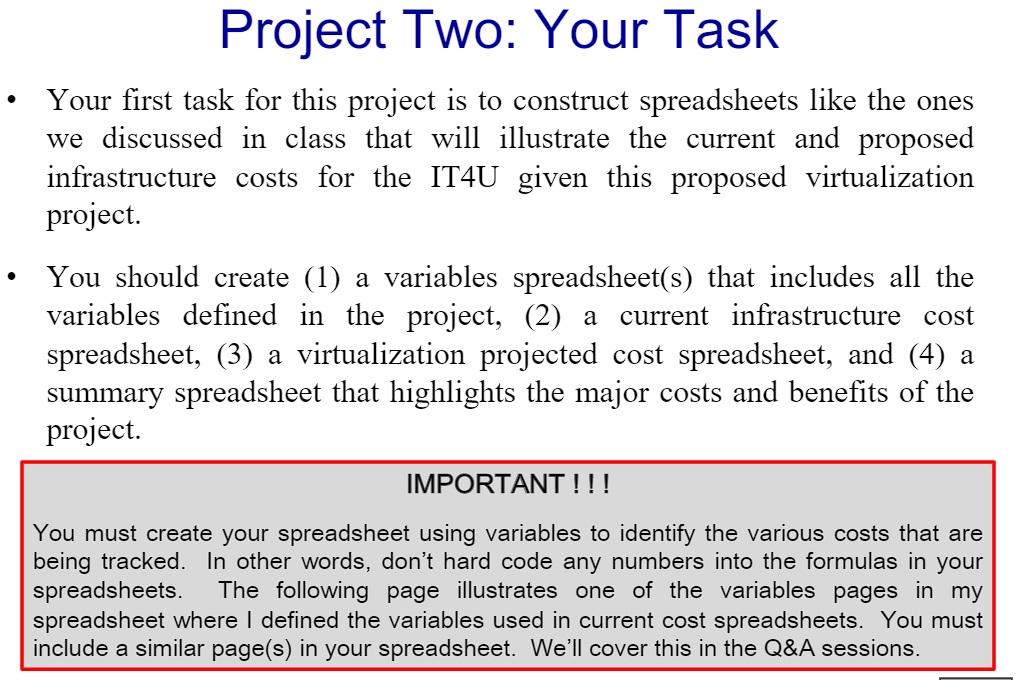
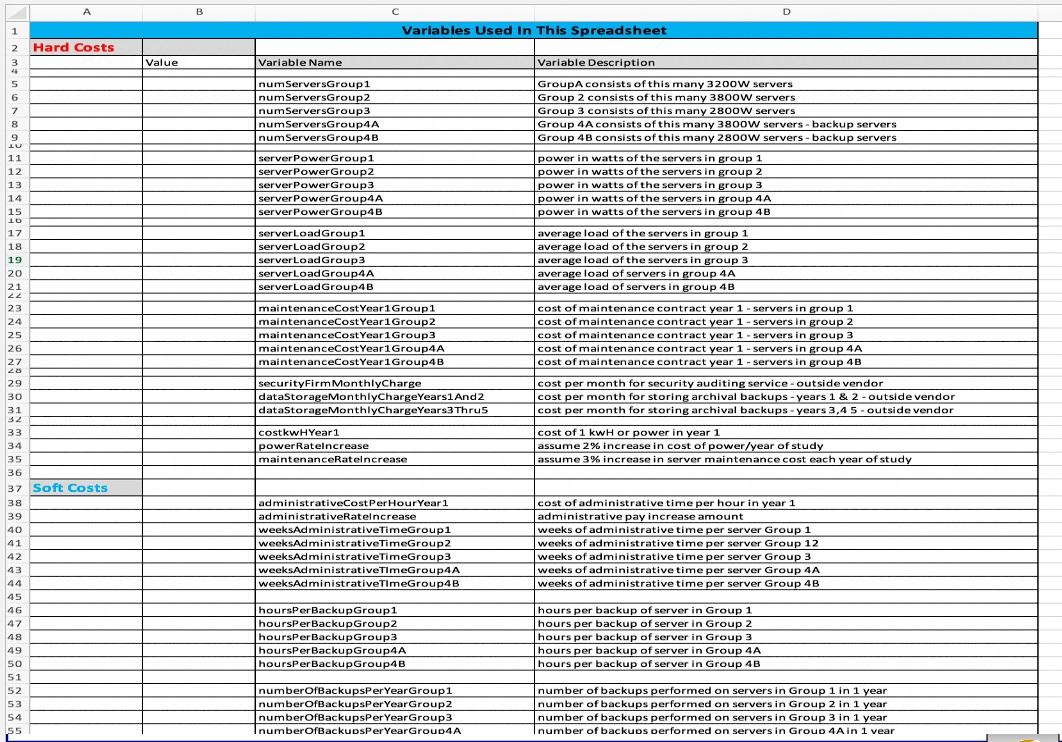
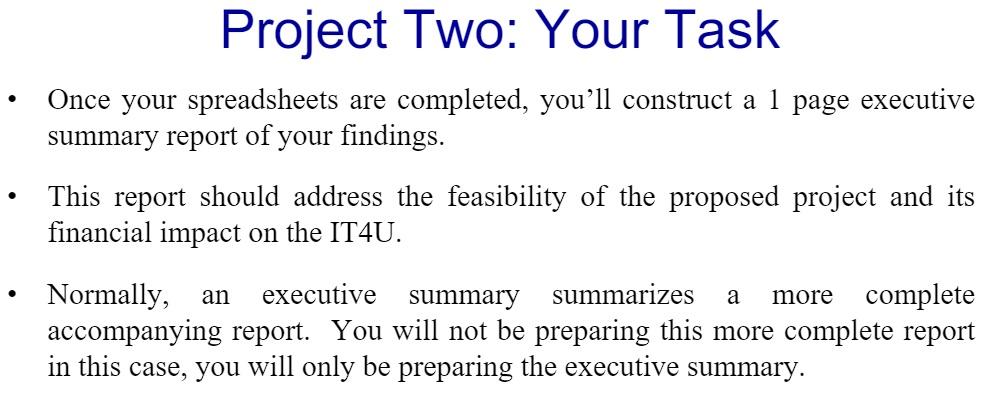
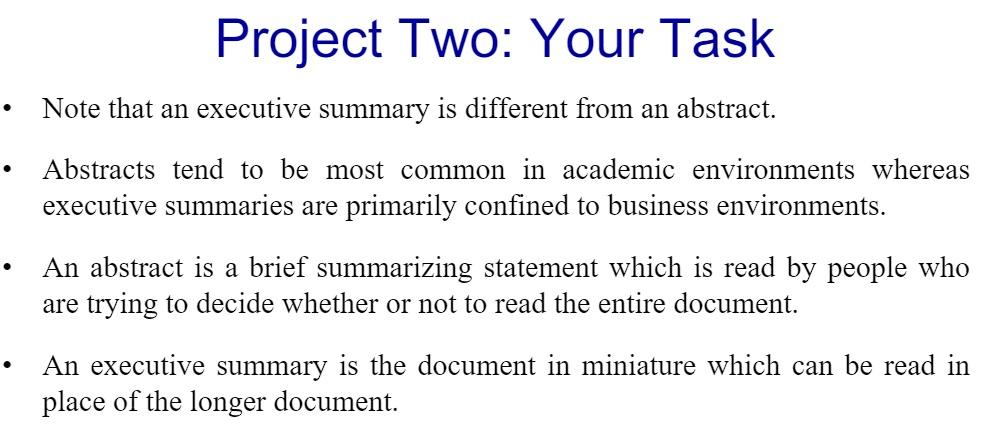
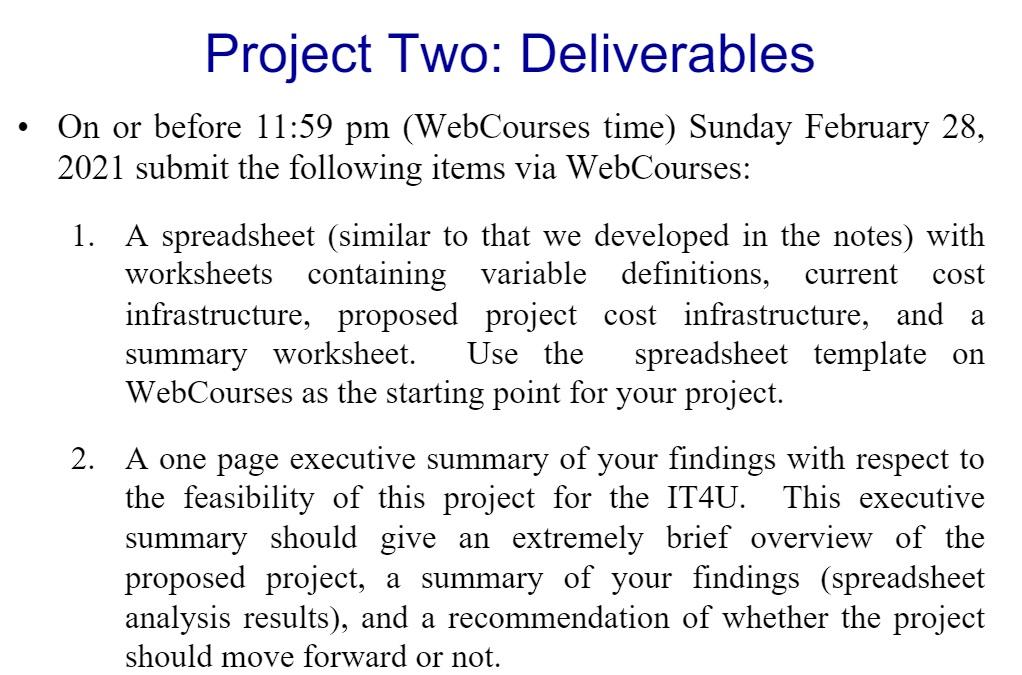
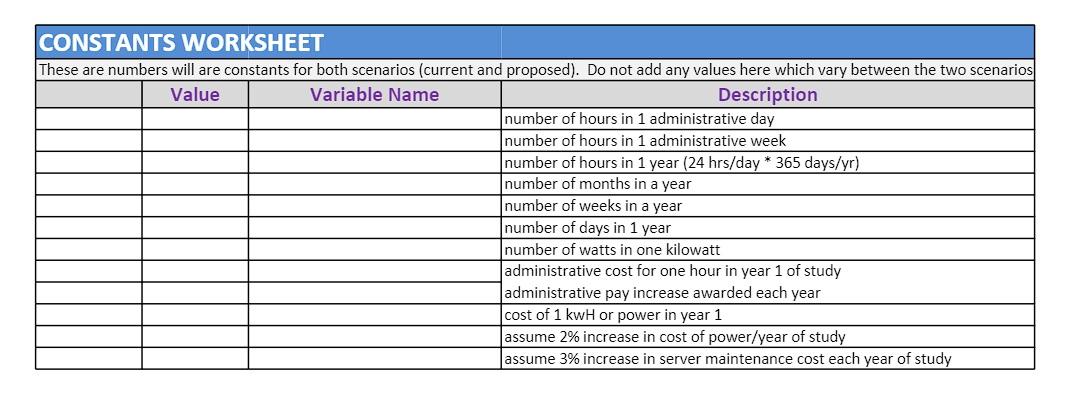
Objectives: 1. To practice conducting a financial feasibility (cost/benefit) analysis for a server virtualization project. 2. To prepare an executive summary of the feasibility analysis. Project Two: Overview . What you are going to do in this project is pretend that you are the system administrator for an organization that is attempting to determine if virtualization of its computing server infrastructure would be beneficial to the organization from a financial perspective. As the system administrator you are in charge of conducting the feasibility analysis for the project. This will include creating financial spreadsheets using a 5-year time-line and writing a brief report summarizing your findings Project Two: Overview . As explained in the notes, a feasibility analysis such as this requires that you be able to compare the way the organization is currently operating with the proposed changes to the operation. Thus, the first step in the analysis is to completely determine the costs associated with the current operational technique. . For this project, we will restrict the analysis to only a server virtualization project. This means that we need to develop a complete cost picture of the current server infrastructure to compare to a proposed server infrastructure cost. The next few pages describe the current infrastructure of the organization and this will be followed by a proposed infrastructure. Let's call the organization: IT4U. Project Two: The Current Scenario Currently IT4U is running 5000 physical servers in its data center which support various applications and several different operating systems. . These servers are configured into four different groups: Group 1 consists of 2500 mission critical servers. Group 1 servers consume 3500W of power each at full load (100% CPU utilization). The Group 1 servers average load is 15%. Group 2 consists of 1000 mission critical servers. Group 2 servers consume 4200W of power each at full load (100% CPU utilization). The Group 2 servers average load is 25%. Group 3 consists of 500 non-mission critical in-house application and file servers, each of which consumes 2800W of power at full load. The servers in this group run with an average load of 10% Group 4 consists of a pool of 1000 redundant servers utilized as backup servers. The Group 4 servers are split into two subgroups of 500 servers each, call them Group 4A and Group 4B. Group 4A servers draw 3800W at full load and are used as backups for Group 1 and Group 2 servers. The Group 4B servers draw 2800W at full load and are used as backups for primarily Group 1 and Group 3 servers. Group 4A and 4B servers run at average 1% load. Project Two: The Current Scenario Project Hint #1: The power consumed by a server measured in Watts. Power companies charge for power based on KWH (kilowatt-Hours). The Group 1 servers consume 3500W of power at full load. However, they only average a 15% load, so what they actually consume, on average, is 3500W x 0.15 = 525W. A device that consumes 1000W = 1kW for 1 hour will use 1kWH of power. Thus, the Group 1 servers are consuming 525W = 0.525kW, so in 1 hour they will use 0..525kWH of power. Servers run 24/7 so in 1 day, one Group 1 server will use 0.525kWH x 24hr = 12.6kWH of power. There are 2500 servers in Group 1, so collectively they will consume 2500 x 12.6kWH = 31,500KWH of power in 1 day. Our assumption (see page 18) is that the power company is charging 13 cents/kwH, so, running all Group 1 servers for 1 day will cost: 31500kWH x 0.13$/KWH = $4095.00. For year one, the cost to power Group 1 servers will be $4095.00 x 365 = $1,494,675.00. Project Two: The Current Scenario The server maintenance contracts on the current physical servers are as follows: Group 1 (3500W) servers: $1500.00/server/year Group 2 (4200W) servers: $1750.00/server/year Group 3 (2800W) servers: $1200.00/server/year Group 4A (3800W) servers: $1250.00/server/year Group 4B (2800W) servers: $950.00/server/year Assume that server maintenance costs will increase 3%/year over the duration of the study for all server maintenance agreements. Project Two: The Current Scenario Project Hint #2: _Use a fine grain breakdown of variables in your spreadsheet do not lump together various values. B D Variables Used In This Spreadsheet Do it this way! e Variable Name Variable Description numServersGroup1 numServers Group 2 numServersGroup3 numServersGroup4A numServersGroup4B GroupA consists of this many 3200W servers Group 2 consists of this many 3800W servers Group 3 consists of this many 2800W servers Group 4A consists of this many 3800W servers - backup servers Group 4B consists of this many 2800W servers - backup servers server PowerGroup1 server PowerGroup2 server PowerGroup3 server PowerGroup4A server PowerGroup4B power in watts of the servers in group 1 power in watts of the servers in group 2 power in watts of the servers in group 3 power in watts of the servers in group 4A Do not do it this way! B D Variables Used In This Spreadsheet serverLoadGroup1 serverLoadGroup 2 serverLoadGroup3 serverLoadGroup4A serverLoadGroup 4B - Value Variable Name Variable Description numServers total number of servers server Power total server power maintenanceCost Year1 Group1 maintenanceCost Year1 Group 2 maintenanceCost Year 1 Group3 maintenanceCost Year1 Group4A maintenanceCost Year 1 Group4B server Load average load of the servers maintenanceCost Year1 cost of maintenance contract year 1 Project Two: The Current Scenario Server administration efforts also vary across the server groups as follows: Group 1 (3500W) servers: 3 administrative weeks/server/year Group 2 (4200W) servers: 3.5 administrative weeks/server/year Group 3 (2800W) servers: 2 administrative weeks/server/year Group 4A (3800W) servers: 2.5 administrative weeks/server/year Group 4B (2800W) servers: 1 administrative weeks/server/year Administrative costs are currently $100/administrative hour. Assume that administrative costs will increase at the rate of 2%/year over the duration of the study. An administrative day is 10 hours long. An administrative week is 7 days long. A server day is 24 hours long. . Project Two: The Current Scenario Server backup efforts also vary across the server groups as follows: Group 1 (3500W) servers: these servers are backed-up nightly and require 45 minutes per server. - Group 2 (4200W) servers: these servers are backed-up nightly and require 1 hour per server. Group 3 (2800W) servers: these servers are backed-up weekly and require 1 hour and 15 minutes per server. Group 4A (3800W) servers: these servers are backed-up weekly and require 90 minutes per server. Group 4B (2800W) servers: these servers are backed-up every other week and require 2 hours per server. Project Two: The Current Scenario . Project Hint #3: . Be careful with units and time. Some servers are backed-up nightly, others weekly or every other week. Example Group 1 servers are backed-up nightly requiring 45 minutes/server. Thus, each server in Group 1 requires 365 x 0.75 hours/year of administrative time for backups. Since you are given the time requirement in minutes and administrative time is based on hours, convert backup effort into hours, so 45 minutes 0.75 hours. Thus, one server in Group 1 requires a total of 273.75 hours of backup time in 1 year. There are 2500 servers in Group 1 so the total time required for backups is 2500 x 273.75 = 684,375 hours. Administrators are paid at the rate of $100.00/hour, so the cost of backing up Group 1 servers for year 1 of the study is 684,375 x 100 = = $68,437,500.00 = . Servers that are backed-up weekly require only 52 backups/year. Similarly, those which are backed-up every other week will require only 27 backups/year. Project Two: The Current Scenario IT4U currently employs an external security firm to run routine security audits on the mission critical servers (Groups 1 and 2). This occurs once a month and the charge is $5500.00. The current contract with this firm guarantees this price through the duration of this study. IT4U currently employs a data storage company to maintain archival backup copies of server backups. The charge for this service is billed monthly and is based on the data volume stored each month. The bill last month was $7500.00. Based on the data volume trend produced by IT4U, it is expected that the next billing level plateau will be achieved at the start of year 3 of the study when the monthly cost will rise to $10,000.00/month. This rate is expected to remain the same throughout the duration of the study. An aside: According to industry sources, the average cost of storing 1TB of file data is currently $3,351.00/year (about $280.00/month). The rate shown above for the archival backup service, for year 1, would be correct for an organization which is archiving about 27 TB/month. Project Two: The Proposed Scenario The virtualization project proposed for the IT4U would reduce its total current number of physical servers from 5000 to 500 (an overall 10:1 physical consolidation ratio). The proposed reduction in physical servers and the resulting number of virtual servers per server group will be based on the following table: Group Number of New Physical Servers Physical Server Consolidation Ratio Number of Virtual Servers Total Number of Servers in Group (physical + virtual) Overall Consolidation Ratio 1 250 10:1 2000 2250 1.11:1 2 200 5:1 700 900 1.11:1 3 20 25:1 150 170 5.88:1 4 30 33.33:1 300 330 3.03:1 Total 500 10:1 3150 3650 1.37:1 Sun Server X8-8 servers have been selected to host the virtualized environments. This is one of Sun's latest and leading edge x86 servers. This is a 5-rack unit (5U) server that supports installations of 24 cores/socket. Up to 6TB of memory is available. Project Two: The Proposed Scenario Project Hint #4: Note that in our proposed scenario some of the original servers are actually lost in the virtualization scenario. For example, the Group 1 servers are reduced from 2500 physical servers to 250 physical servers (a consolidation ration of 10:1). The original 5000 servers are replaced with 250 new physical servers and these new physical servers will support a total of 2000 virtual servers. In this case, we lost 500 of the original servers. Similarly, in Group 3 the physical servers are reduced from 500 to 20 (a consolidation ratio of 25:1) and the original 500 physical servers are now running as 150 virtual servers. Although it isn't really important to us in this study, the most likely scenario is that the tasks/applications/functionality of the original 500 servers will be distributed across the 150 virtual servers, and the 20 new physical servers will only be tasked with supporting the virtual machines and probably will have no other functionality assigned to them in the proposed scenario. . Due to the efficiency of the new servers and the virtualization of others, we can afford to reduce the total number of servers. Notice that the overall group consolidation ratios are all less than 6:1, with the mission critical consolidation ratios less than 2:1. . The next page will let you know how to specify the configuration of the new physical servers that IT4U will be purchasing for this proposed project. Sun Server X8-8 & DA Use the configurations shown below: Processor = Intel Xeon 8268 2.9GHz, 24 core, 205W CPUs = 8 Memory (64GB DIMM) = 96 DIMMs Memory (32GB DIMM) = none Memory (16GB DIMM) = none Hard Disk Drives = none Solid State Drives = 8 SSDs PCI-Express Card = 16 PCle Cards Workload = 85% for Group1 and 60% for Group 2 Group 1 and Group 2 Server configurations OP 13 . Use these different configuration settings to determine the power usage for each of the servers in your new server groups Processor = Intel Xeon 5218 2.3GHz, 16 core, 125W CPUs = 4 Memory (64GB DIMM) = 48 DIMMs Memory (32 GB DIMM) = none Memory (16GB DIMM) = none Hard Disk Drives = none Solid State Drives = 4 SSDs PCI-Express Card = 8 PCle Cards Workload = 75% for Group 3 and 50% for Group 4 Group 3 and 4 configurations Fujitsu SPARC M12-2 Server Configurations The Fujitsu M12-2 server is a high-performance, highly reliable midrange server that is ideal for data center integration and virtualization. It can be configured with as many as 24 cores, large memory, and large disk capacity. Processor resources can be expanded incrementally with the CPU Activation feature, which supports adding processor resources one core at a time. Its SPARC64 XII ("twelve") processor was developed to deliver dramatic high-speed performance by implementing instructions in hardware that accelerate key Software on Chip functions. The Fujitsu SPARC M12-2 server enables flexible system configuration with two no-cost virtualization technologies, Oracle VM Server for SPARC and the Oracle Solaris Zones. Small Large System List Price US$56,611.00 US$237,731.00 First Year Oracle Premier Support for Systems US$6,793.32 US$28,52772 Note that this cost calculator is actually for the Fujitsu SPARC M12-2 server, which is different than the X8-8 servers that we configured for the power. While this configuration is not exactly the same as that which we configured for the power calculator, its pretty close and will give us an accurate enough value for inclusion in our analysis. Use the Small configuration for the Group 3 and 4 servers and the Large configuration for Group 1 and 2 servers. Use this as the price for your new servers. Also note the price for the first year of Oracle's Premier level support for this system and use this price as the first year price for the maintenance contract on each server. (Note that these prices are 12% of the server cost.) Project Two: The Proposed Scenario . The virtualization software of choice will be VMware (we'll use VMware vSphere) and this will cost $6500/physical server. The yearly maintenance contract on this software will be priced at 15% of the original cost and will remain in effect at this rate for the duration of the study. . Each new server will be under a server maintenance contract that will have an initial cost as per your research (from link on page 15) and this cost will increase by 3% in each year of the study. Note that this increase is different than for the current scenario. . Its estimated that all new servers (both physical and virtual) will require 10 weeks/server/year of administrative effort. Groups 1, 2, and 3 will require a backup effort assumed to be 90 min/physical server/day. Group 4 servers will require 120 min/physical server/week. . Training employees on the new virtualized systems will require a time expenditure equivalent to $2500/year/employee trained on the system. In years 1 and 2 of the study four employees will be trained and in all subsequent years of the study two employees will be trained per year. Project Two: The Proposed Scenario Project Hint #5: Physical servers require backups, virtual servers do not. The virtual server resides on the physical server, so in backing up the physical server, the virtual servers residing on that physical server are also backed up. Both physical and virtual servers require administrative efforts. The difference (see page 16) is that the administrative cost/effort on a virtual machine is assumed to be only 50% of the administrative cost/effort on a virtual machine. For example, if a physical server requires 10 hours of administrative effort/week, then the cost for that would be 10 hours x $100.00/hour = $1000.00. If that physical server hosted 4 virtual machines that also each required 10 hours of administrative cost/effort/week, then the cost for administering the virtual machines would be (4 x 10 hours x $100.00/hour) * 0.5 = $2000.00. Thus the total administrative cost/effort on that one physical server in 1 week would be $1000.00 + $2000.00 $3000.00. Project Two Common Elements Some basic assumptions about IT4U and the future as it pertains to your feasibility analysis: The cost of lkwH of power is currently 13 cents. Assume that the cost of power will increase 2%/year over the duration of the study. When calculating power costs for the new servers, note that the loading of each server was already factored into the value produced by the power calculator. Assume that server maintenance costs will increase 3%/year over the duration of the study for all server maintenance agreements. The outside service contracts for security and storage will continue in the proposed scenario just as they were calculated in the current scenario. Assume that administrative costs on a virtual server are 50% of the administrative costs on a physical server. 1 administrative day is 10 hours long. 1 server day is 24 hours long. There are 365 days in one year. Administrative costs are currently $100/administrative hour. Assume that administrative costs will increase at the rate of 2%/year over the duration of the study. Project Two: Your Task Your first task for this project is to construct spreadsheets like the ones we discussed in class that will illustrate the current and proposed infrastructure costs for the IT4U given this proposed virtualization project. You should create (1) a variables spreadsheet(s) that includes all the variables defined in the project, (2) a current infrastructure cost spreadsheet, (3) a virtualization projected cost spreadsheet, and (4) a summary spreadsheet that highlights the major costs and benefits of the project. IMPORTANT!!! You must create your spreadsheet using variables to identify the various costs that are being tracked. In other words, don't hard code any numbers into the formulas in your spreadsheets. The following page illustrates one of the variables pages in my spreadsheet where I defined the variables used in current cost spreadsheets. You must include a similar page(s) in your spreadsheet. We'll cover this in the Q&A sessions. B D Variables Used In This Spreadsheet 1 Hard Costs 2 3 48 Value Variable Name Variable Description 5 6 7 8 num Servers Group1 numServersGroup2 numServersGroup3 numServersGroup4A numServersGroup4B GroupA consists of this many 3200w servers Group 2 consists of this many 3800W servers Group 3 consists of this many 2800W servers Group 4 A consists of this many 3800w servers - backup servers Group 4B consists of this many 2800W servers - backup servers power in watts of the servers in group 1 power in watts of the servers in group 2 2 power in watts of the servers in group 3 power in watts of the servers in group 4A power in watts of the servers in group 4B server PowerGroup1 server PowerGroup2 server Power Group3 server PowerGroup4A server PowerGroup4B serverLoad Group1 serverLoad Group2 serverLoadGroup3 server LoadGroup4A server Load Group4B 9 10 11 12 13 14 15 10 17 18 19 20 21 22 23 24 25 26 27 20 29 30 31 32 33 34 35 36 37 Soft Costs 38 39 40 41 maintenanceCost Year 1 Group 1 maintenanceCost Year 1 Group 2 maintenanceCost Year 1 Group3 maintenanceCost Year 1 Group4A maintenanceCost Year 1 Group4B average load of the servers in group 1 average load of the servers in group 2 average load of the servers in group 3 average load of servers in group 4A average load of servers in group 4B cost of maintenance contract year 1 - servers in group 1 cost of maintenance contract year 1 - servers in group 2 cost of maintenance contract year 1-servers in group 3 cost of maintenance contract year 1 - servers in group 4A cost of maintenance contract year 1 - servers in group 4B cost per month for security auditing service - outside vendor cost per month for storing archival backups - years 1 & 2 - outside vendor cost per month for storing archival backups - years 3,4 5 - outside vendor cost of 1 kwh or power in year 1 assume 2% increase in cost of power/year of study assume 3% increase in server maintenance cost each year of study security Firm MonthlyCharge dataStorageMonthlycharge Years1 And2 dataStorage MonthlyChargeYears3 Thrus costkwHYear1 power Ratelncrease maintenanceRatelncrease administrativeCost Per Hour Year 1 administrativeRatelncrease weeksAdministrative TimeGroup1 weeksAdministrative TimeGroup2 weeksAdministrative TimeGroup3 weeksAdministrative TimeGroup4A weeksAdministrativeTimeGroup4B cost of administrative time per hour in year 1 administrative pay increase amount weeks of administrative time per server Group 1 weeks of administrative time per server Group 12 weeks of administrative time per server Group 3 weeks of administrative time per server Group 4A weeks of administrative time per server Group 4B 42 43 44 45 46 47 48 49 SO 51 52 53 54 55 hoursPer BackupGroup1 hoursPer BackupGroup2 hoursPer Backup Group3 hoursPer Backup Group4A hoursPer BackupGroup4B hours per backup of server in Group 1 hours per backup of server in Group 2 hours per backup of server in Group 3 hours per backup of server in Group 4A hours per backup of server in Group 4B numberOfBackupsPer Year Group1 numberOfBackupsPer Year Group2 numberOfBackupsPer Year Group3 InumberOfBackupsPer Year Group4A number of backups performed on servers in Group 1 in 1 year number of backups performed on servers in Group 2 in 1 year number of backups performed on servers in Group 3 in 1 year Inumber of backups performed on servers in Group 4A in 1 vear Project Two: Your Task . Once your spreadsheets are completed, you'll construct a 1 page executive summary report of your findings. This report should address the feasibility of the proposed project and its financial impact on the IT4U. . an a more Normally, executive summary summarizes complete accompanying report. You will not be preparing this more complete report in this case, you will only be preparing the executive summary. Project Two: Your Task Note that an executive summary is different from an abstract. Abstracts tend to be most common in academic environments whereas executive summaries are primarily confined to business environments. An abstract is a brief summarizing statement which is read by people who are trying to decide whether or not to read the entire document. An executive summary is the document in miniature which can be read in place of the longer document. Project Two: Deliverables On or before 11:59 pm (WebCourses time) Sunday February 28, 2021 submit the following items via WebCourses: 1. A spreadsheet (similar to that we developed in the notes) with worksheets containing variable definitions, current cost infrastructure, proposed project cost infrastructure, and a summary worksheet. Use the spreadsheet template on WebCourses as the starting point for your project. 2. A one page executive summary of your findings with respect to the feasibility of this project for the IT4U. This executive summary should give an extremely brief overview of the proposed project, a summary of your findings (spreadsheet analysis results), and a recommendation of whether the project should move forward or not. CONSTANTS WORKSHEET These are numbers will are constants for both scenarios (current and proposed). Do not add any values here which vary between the two scenarios Value Variable Name Description number of hours in 1 administrative day number of hours in 1 administrative week number of hours in 1 year (24 hrs/day * 365 days/yr) number of months in a year number of weeks in a year number of days in 1 year number of watts in one kilowatt administrative cost for one hour in year 1 of study administrative pay increase awarded each year cost of 1 kwH or power in year 1 assume 2% increase in cost of power/year of study assume 3% increase in server maintenance cost each year of study CURRENT SCENARIO VARIABLES WORKSHEET Hard Costs Value Variable Name Variable Description GroupA consists of this many 3500W servers Group 2 consists of this many 4200W servers Group 3 consists of this many 2800W servers Group 4A consists of this many 3800W servers - backup servers Group 4B consists of this many 2800W servers - backup servers power in watts of the servers in group 1 power in watts of the servers in group 2 power in watts of the servers in group 3 power in watts of the servers in group 4A power in watts of the servers in group 4B average load of the servers in group 1 average load of the servers in group 2 average load of the servers in group 3 average load of servers in group 4A average load of servers in group 4B cost of maintenance contract year 1 - servers in group 1 cost of maintenance contract year 1 - servers in group 2 cost of maintenance contract year 1 - servers in group 3 cost of maintenance contract year 1-servers in group 4A cost of maintenance contract year 1-servers in group 48 cost per month for security auditing service - outside vendor cost per month for storing archival backups - years 1 & 2 - outside vendor cost per month for storing archival backups - years 3,45 - outside vendor Soft Costs Value Variable Name Variable Description administrative pay increase amount weeks of administrative time per server Group 1 weeks of administrative time per server Group 12 weeks of administrative time per server Group 3 weeks of administrative time per server Group 4A weeks of administrative time per server Group 4B hours per backup of server in Group 1 hours per backup of server in Group 2 hours per backup of server in Group 3 hours per backup of server in Group 4A hours per backup of server in Group 4B number of backups performed on servers in Group 1 in 1 year number of backups performed on servers in Group 2 in 1 year number of backups performed on servers in Group 3 in 1 year number of backups performed on servers in Group 4A in 1 year number of backups performed on servers in Group 4B in 1 year CURRENT SCENARIO WORKSHEET Category Cost Year 3 5 Year Totals Year 1 Year 2 Year 4 Year 5 #REF! Hard Costs Power - Group 1 Power - Group 2 Power - Group 3 Power - Group 4A Power - Group 4B Total Power Costs/Year Server Maintenance - Group 1 Server Maintenance - Group 2 Server Maintenance - Group 3 Server Maintenance - Group 4A Server Maintenance - Group 4B Total Server Maintenance Costs/Year Security Auditing Costs Archival/Storage Costs Total Yearly Hard Costs Total Five Year Hard Costs = Soft Costs Server Administration - Group Server Administration - Group 2 Server Administration - Group 3 Server Administration - Group 4A Server Administration - Group 4B Total Server Administration Costs/Year Server Backup - Group 1 Server Backup - Group 3 Server Backup - Group 3 Server Backup - Group 4A Server Backup - Group 4B Total Server Backup Costs/Year Total Yearly Soft Costs Total Five Year Soft Costs = Total Current Cost/Year Total 5 YearCurrent Cost PROPOSED SCENARIO VARIABLES WORKSHEET Hard Costs Value Variable Name Variable Description cost of a new group 1 server first year service maintenance cost for server in group 1 cost of a new group 2 server first year service maintenance cost for server in group 2 cost of a new group 3 server first year service maintenance cost for server in group 3 cost of a new group 4 server first year service maintenance cost for server in group 4 number of new physical servers in Group 1 number of virtualized servers in Group 1 number of new physical servers in Group 2 number of virtualized servers in Group 2 number of new physical servers in Group 3 number of virtualized servers in Group 3 number of new physical servers in Group 4 number of virtualized servers in Group 4 power in watts of a server in group 1 power in watts of a server in group 2 power in watts of a server in group 3 power in watts of a server in group 4 cost in dollars for virtualization software for 1 server. % of original cost to maintain virtualization software cost per year to train one employee on virtualized system number of employees trained in years 1 and 2 of the study number of employees trained in years 3 through 5 of the study Soft Costs Value Variable Name Variable Description estimated number of weeks/year of administrative time per new physical server percentage of regular admin cost associated with a virtual server hours per backup of physical servers + virtual servers - Group 1 hours per backup of physical servers + virtual servers - Group 2 hours per backup of physical servers + virtual servers - Group 3 hours per backup of physical servers + virtual servers - Group 4 number of backup of physical servers + virtual servers per year - Group 1 number of backup of physical servers + virtual servers per year - Group 2 number of backup of physical servers + virtual servers per year - Group 3 number of backup of physical servers + virtual servers per year - Group 4 5 Year Totals Year 5 Virtualized Infrastructure Yearly Costs - Proposed Project Costs Category Cost Year 1 Year 2 Year 3 Year 4 Hard Costs Machine Purchases Software Purchases Software Maintenance Power - Group 1 Power - Group 2 Power - Group 3 Powert Group 4 Server Maintenance - Group 1 Server Maintenance - Group 2 Server Maintenance - Group 3 Server Maintenance - Group 4 Training Security Auditing Costs Archival/Storage Costs Total Yearly Hard Costs Total Five Year Hard Costs Soft Costs Server Administration Group 1 - Physical Server Admin Group 1 - Virtual Systems Server Administration Group 2 - Physical Server Admin Group 2 - Virtual Systems Server Administration Group 3 - Physical Server Admin Group 3 - Virtual Systems Server Administration Group 4 - Physical Server Administration Group 4 - Virtual Total Administration Cost/Year Group 1 Backup Group 2 Backup Group 3 Backup Group 4 Backup Total Backup Cost/Year Total Yearly Soft Costs Total Five Year Soft Costs = Total Proposed Project Costs/Year Total 5 Year Proposed Project Cost PROPOSED SCENARIO VARIABLES WORKSHEET Hard Costs Value Variable Name Variable Description cost of a new group 1 server first year service maintenance cost for server in group 1 cost of a new group 2 server first year service maintenance cost for server in group 2 cost of a new group 3 server first year service maintenance cost for server in group 3 cost of a new group 4 server first year service maintenance cost for server in group 4 number of new physical servers in Group 1 number of virtualized servers in Group 1 number of new physical servers in Group 2 number of virtualized servers in Group 2 number of new physical servers in Group 3 number of virtualized servers in Group 3 number of new physical servers in Group 4 number of virtualized servers in Group 4 power in watts of a server in group 1 power in watts of a server in group 2 power in watts of a server in group 3 power in watts of a server in group 4 cost in dollars for virtualization software for 1 server. % of original cost to maintain virtualization software cost per year to train one employee on virtualized system number of employees trained in years 1 and 2 of the study number of employees trained in years 3 through 5 of the study Soft Costs Value Variable Name Variable Description estimated number of weeks/year of administrative time per new physical server percentage of regular admin cost associated with a virtual server hours per backup of physical servers + virtual servers - Group 1 hours per backup of physical servers + virtual servers - Group 2 hours per backup of physical servers + virtual servers - Group 3 hours per backup of physical servers + virtual servers - Group 4 number of backup of physical servers + virtual servers per year - Group 1 number of backup of physical servers + virtual servers per year - Group 2 number of backup of physical servers + virtual servers per year - Group 3 number of backup of physical servers + virtual servers per year - Group 4 5 Year Totals Year 5 Virtualized Infrastructure Yearly Costs - Proposed Project Costs Category Cost Year 1 Year 2 Year 3 Year 4 Hard Costs Machine Purchases Software Purchases Software Maintenance Power - Group 1 Power - Group 2 Power - Group 3 Powert Group 4 Server Maintenance - Group 1 Server Maintenance - Group 2 Server Maintenance - Group 3 Server Maintenance - Group 4 Training Security Auditing Costs Archival/Storage Costs Total Yearly Hard Costs Total Five Year Hard Costs Soft Costs Server Administration Group 1 - Physical Server Admin Group 1 - Virtual Systems Server Administration Group 2 - Physical Server Admin Group 2 - Virtual Systems Server Administration Group 3 - Physical Server Admin Group 3 - Virtual Systems Server Administration Group 4 - Physical Server Administration Group 4 - Virtual Total Administration Cost/Year Group 1 Backup Group 2 Backup Group 3 Backup Group 4 Backup Total Backup Cost/Year Total Yearly Soft Costs Total Five Year Soft Costs = Total Proposed Project Costs/Year Total 5 Year Proposed Project Cost Virtualization Project Cost Summary Category Cost Year 3 Year 1 Year 2 Year 4 Year 5 Current Infrastructure Costs Total Yearly Hard Costs Total Five Year Hard Costs Total Yearly Soft Costs Total Five Year Soft Costs Total 5 Year Cost Virtualized Infrastructure Costs Total Yearly Hard Costs Total Five Year Hard Costs Total Yearly Soft Costs Total Five Year Soft Costs Total 5 Year Cost Net Five Year Hard Cost Savings Net Five Year Soft Cost Savings Net Five Year Overall Cost Savings Objectives: 1. To practice conducting a financial feasibility (cost/benefit) analysis for a server virtualization project. 2. To prepare an executive summary of the feasibility analysis. Project Two: Overview . What you are going to do in this project is pretend that you are the system administrator for an organization that is attempting to determine if virtualization of its computing server infrastructure would be beneficial to the organization from a financial perspective. As the system administrator you are in charge of conducting the feasibility analysis for the project. This will include creating financial spreadsheets using a 5-year time-line and writing a brief report summarizing your findings Project Two: Overview . As explained in the notes, a feasibility analysis such as this requires that you be able to compare the way the organization is currently operating with the proposed changes to the operation. Thus, the first step in the analysis is to completely determine the costs associated with the current operational technique. . For this project, we will restrict the analysis to only a server virtualization project. This means that we need to develop a complete cost picture of the current server infrastructure to compare to a proposed server infrastructure cost. The next few pages describe the current infrastructure of the organization and this will be followed by a proposed infrastructure. Let's call the organization: IT4U. Project Two: The Current Scenario Currently IT4U is running 5000 physical servers in its data center which support various applications and several different operating systems. . These servers are configured into four different groups: Group 1 consists of 2500 mission critical servers. Group 1 servers consume 3500W of power each at full load (100% CPU utilization). The Group 1 servers average load is 15%. Group 2 consists of 1000 mission critical servers. Group 2 servers consume 4200W of power each at full load (100% CPU utilization). The Group 2 servers average load is 25%. Group 3 consists of 500 non-mission critical in-house application and file servers, each of which consumes 2800W of power at full load. The servers in this group run with an average load of 10% Group 4 consists of a pool of 1000 redundant servers utilized as backup servers. The Group 4 servers are split into two subgroups of 500 servers each, call them Group 4A and Group 4B. Group 4A servers draw 3800W at full load and are used as backups for Group 1 and Group 2 servers. The Group 4B servers draw 2800W at full load and are used as backups for primarily Group 1 and Group 3 servers. Group 4A and 4B servers run at average 1% load. Project Two: The Current Scenario Project Hint #1: The power consumed by a server measured in Watts. Power companies charge for power based on KWH (kilowatt-Hours). The Group 1 servers consume 3500W of power at full load. However, they only average a 15% load, so what they actually consume, on average, is 3500W x 0.15 = 525W. A device that consumes 1000W = 1kW for 1 hour will use 1kWH of power. Thus, the Group 1 servers are consuming 525W = 0.525kW, so in 1 hour they will use 0..525kWH of power. Servers run 24/7 so in 1 day, one Group 1 server will use 0.525kWH x 24hr = 12.6kWH of power. There are 2500 servers in Group 1, so collectively they will consume 2500 x 12.6kWH = 31,500KWH of power in 1 day. Our assumption (see page 18) is that the power company is charging 13 cents/kwH, so, running all Group 1 servers for 1 day will cost: 31500kWH x 0.13$/KWH = $4095.00. For year one, the cost to power Group 1 servers will be $4095.00 x 365 = $1,494,675.00. Project Two: The Current Scenario The server maintenance contracts on the current physical servers are as follows: Group 1 (3500W) servers: $1500.00/server/year Group 2 (4200W) servers: $1750.00/server/year Group 3 (2800W) servers: $1200.00/server/year Group 4A (3800W) servers: $1250.00/server/year Group 4B (2800W) servers: $950.00/server/year Assume that server maintenance costs will increase 3%/year over the duration of the study for all server maintenance agreements. Project Two: The Current Scenario Project Hint #2: _Use a fine grain breakdown of variables in your spreadsheet do not lump together various values. B D Variables Used In This Spreadsheet Do it this way! e Variable Name Variable Description numServersGroup1 numServers Group 2 numServersGroup3 numServersGroup4A numServersGroup4B GroupA consists of this many 3200W servers Group 2 consists of this many 3800W servers Group 3 consists of this many 2800W servers Group 4A consists of this many 3800W servers - backup servers Group 4B consists of this many 2800W servers - backup servers server PowerGroup1 server PowerGroup2 server PowerGroup3 server PowerGroup4A server PowerGroup4B power in watts of the servers in group 1 power in watts of the servers in group 2 power in watts of the servers in group 3 power in watts of the servers in group 4A Do not do it this way! B D Variables Used In This Spreadsheet serverLoadGroup1 serverLoadGroup 2 serverLoadGroup3 serverLoadGroup4A serverLoadGroup 4B - Value Variable Name Variable Description numServers total number of servers server Power total server power maintenanceCost Year1 Group1 maintenanceCost Year1 Group 2 maintenanceCost Year 1 Group3 maintenanceCost Year1 Group4A maintenanceCost Year 1 Group4B server Load average load of the servers maintenanceCost Year1 cost of maintenance contract year 1 Project Two: The Current Scenario Server administration efforts also vary across the server groups as follows: Group 1 (3500W) servers: 3 administrative weeks/server/year Group 2 (4200W) servers: 3.5 administrative weeks/server/year Group 3 (2800W) servers: 2 administrative weeks/server/year Group 4A (3800W) servers: 2.5 administrative weeks/server/year Group 4B (2800W) servers: 1 administrative weeks/server/year Administrative costs are currently $100/administrative hour. Assume that administrative costs will increase at the rate of 2%/year over the duration of the study. An administrative day is 10 hours long. An administrative week is 7 days long. A server day is 24 hours long. . Project Two: The Current Scenario Server backup efforts also vary across the server groups as follows: Group 1 (3500W) servers: these servers are backed-up nightly and require 45 minutes per server. - Group 2 (4200W) servers: these servers are backed-up nightly and require 1 hour per server. Group 3 (2800W) servers: these servers are backed-up weekly and require 1 hour and 15 minutes per server. Group 4A (3800W) servers: these servers are backed-up weekly and require 90 minutes per server. Group 4B (2800W) servers: these servers are backed-up every other week and require 2 hours per server. Project Two: The Current Scenario . Project Hint #3: . Be careful with units and time. Some servers are backed-up nightly, others weekly or every other week. Example Group 1 servers are backed-up nightly requiring 45 minutes/server. Thus, each server in Group 1 requires 365 x 0.75 hours/year of administrative time for backups. Since you are given the time requirement in minutes and administrative time is based on hours, convert backup effort into hours, so 45 minutes 0.75 hours. Thus, one server in Group 1 requires a total of 273.75 hours of backup time in 1 year. There are 2500 servers in Group 1 so the total time required for backups is 2500 x 273.75 = 684,375 hours. Administrators are paid at the rate of $100.00/hour, so the cost of backing up Group 1 servers for year 1 of the study is 684,375 x 100 = = $68,437,500.00 = . Servers that are backed-up weekly require only 52 backups/year. Similarly, those which are backed-up every other week will require only 27 backups/year. Project Two: The Current Scenario IT4U currently employs an external security firm to run routine security audits on the mission critical servers (Groups 1 and 2). This occurs once a month and the charge is $5500.00. The current contract with this firm guarantees this price through the duration of this study. IT4U currently employs a data storage company to maintain archival backup copies of server backups. The charge for this service is billed monthly and is based on the data volume stored each month. The bill last month was $7500.00. Based on the data volume trend produced by IT4U, it is expected that the next billing level plateau will be achieved at the start of year 3 of the study when the monthly cost will rise to $10,000.00/month. This rate is expected to remain the same throughout the duration of the study. An aside: According to industry sources, the average cost of storing 1TB of file data is currently $3,351.00/year (about $280.00/month). The rate shown above for the archival backup service, for year 1, would be correct for an organization which is archiving about 27 TB/month. Project Two: The Proposed Scenario The virtualization project proposed for the IT4U would reduce its total current number of physical servers from 5000 to 500 (an overall 10:1 physical consolidation ratio). The proposed reduction in physical servers and the resulting number of virtual servers per server group will be based on the following table: Group Number of New Physical Servers Physical Server Consolidation Ratio Number of Virtual Servers Total Number of Servers in Group (physical + virtual) Overall Consolidation Ratio 1 250 10:1 2000 2250 1.11:1 2 200 5:1 700 900 1.11:1 3 20 25:1 150 170 5.88:1 4 30 33.33:1 300 330 3.03:1 Total 500 10:1 3150 3650 1.37:1 Sun Server X8-8 servers have been selected to host the virtualized environments. This is one of Sun's latest and leading edge x86 servers. This is a 5-rack unit (5U) server that supports installations of 24 cores/socket. Up to 6TB of memory is available. Project Two: The Proposed Scenario Project Hint #4: Note that in our proposed scenario some of the original servers are actually lost in the virtualization scenario. For example, the Group 1 servers are reduced from 2500 physical servers to 250 physical servers (a consolidation ration of 10:1). The original 5000 servers are replaced with 250 new physical servers and these new physical servers will support a total of 2000 virtual servers. In this case, we lost 500 of the original servers. Similarly, in Group 3 the physical servers are reduced from 500 to 20 (a consolidation ratio of 25:1) and the original 500 physical servers are now running as 150 virtual servers. Although it isn't really important to us in this study, the most likely scenario is that the tasks/applications/functionality of the original 500 servers will be distributed across the 150 virtual servers, and the 20 new physical servers will only be tasked with supporting the virtual machines and probably will have no other functionality assigned to them in the proposed scenario. . Due to the efficiency of the new servers and the virtualization of others, we can afford to reduce the total number of servers. Notice that the overall group consolidation ratios are all less than 6:1, with the mission critical consolidation ratios less than 2:1. . The next page will let you know how to specify the configuration of the new physical servers that IT4U will be purchasing for this proposed project. Sun Server X8-8 & DA Use the configurations shown below: Processor = Intel Xeon 8268 2.9GHz, 24 core, 205W CPUs = 8 Memory (64GB DIMM) = 96 DIMMs Memory (32GB DIMM) = none Memory (16GB DIMM) = none Hard Disk Drives = none Solid State Drives = 8 SSDs PCI-Express Card = 16 PCle Cards Workload = 85% for Group1 and 60% for Group 2 Group 1 and Group 2 Server configurations OP 13 . Use these different configuration settings to determine the power usage for each of the servers in your new server groups Processor = Intel Xeon 5218 2.3GHz, 16 core, 125W CPUs = 4 Memory (64GB DIMM) = 48 DIMMs Memory (32 GB DIMM) = none Memory (16GB DIMM) = none Hard Disk Drives = none Solid State Drives = 4 SSDs PCI-Express Card = 8 PCle Cards Workload = 75% for Group 3 and 50% for Group 4 Group 3 and 4 configurations Fujitsu SPARC M12-2 Server Configurations The Fujitsu M12-2 server is a high-performance, highly reliable midrange server that is ideal for data center integration and virtualization. It can be configured with as many as 24 cores, large memory, and large disk capacity. Processor resources can be expanded incrementally with the CPU Activation feature, which supports adding processor resources one core at a time. Its SPARC64 XII ("twelve") processor was developed to deliver dramatic high-speed performance by implementing instructions in hardware that accelerate key Software on Chip functions. The Fujitsu SPARC M12-2 server enables flexible system configuration with two no-cost virtualization technologies, Oracle VM Server for SPARC and the Oracle Solaris Zones. Small Large System List Price US$56,611.00 US$237,731.00 First Year Oracle Premier Support for Systems US$6,793.32 US$28,52772 Note that this cost calculator is actually for the Fujitsu SPARC M12-2 server, which is different than the X8-8 servers that we configured for the power. While this configuration is not exactly the same as that which we configured for the power calculator, its pretty close and will give us an accurate enough value for inclusion in our analysis. Use the Small configuration for the Group 3 and 4 servers and the Large configuration for Group 1 and 2 servers. Use this as the price for your new servers. Also note the price for the first year of Oracle's Premier level support for this system and use this price as the first year price for the maintenance contract on each server. (Note that these prices are 12% of the server cost.) Project Two: The Proposed Scenario . The virtualization software of choice will be VMware (we'll use VMware vSphere) and this will cost $6500/physical server. The yearly maintenance contract on this software will be priced at 15% of the original cost and will remain in effect at this rate for the duration of the study. . Each new server will be under a server maintenance contract that will have an initial cost as per your research (from link on page 15) and this cost will increase by 3% in each year of the study. Note that this increase is different than for the current scenario. . Its estimated that all new servers (both physical and virtual) will require 10 weeks/server/year of administrative effort. Groups 1, 2, and 3 will require a backup effort assumed to be 90 min/physical server/day. Group 4 servers will require 120 min/physical server/week. . Training employees on the new virtualized systems will require a time expenditure equivalent to $2500/year/employee trained on the system. In years 1 and 2 of the study four employees will be trained and in all subsequent years of the study two employees will be trained per year. Project Two: The Proposed Scenario Project Hint #5: Physical servers require backups, virtual servers do not. The virtual server resides on the physical server, so in backing up the physical server, the virtual servers residing on that physical server are also backed up. Both physical and virtual servers require administrative efforts. The difference (see page 16) is that the administrative cost/effort on a virtual machine is assumed to be only 50% of the administrative cost/effort on a virtual machine. For example, if a physical server requires 10 hours of administrative effort/week, then the cost for that would be 10 hours x $100.00/hour = $1000.00. If that physical server hosted 4 virtual machines that also each required 10 hours of administrative cost/effort/week, then the cost for administering the virtual machines would be (4 x 10 hours x $100.00/hour) * 0.5 = $2000.00. Thus the total administrative cost/effort on that one physical server in 1 week would be $1000.00 + $2000.00 $3000.00. Project Two Common Elements Some basic assumptions about IT4U and the future as it pertains to your feasibility analysis: The cost of lkwH of power is currently 13 cents. Assume that the cost of power will increase 2%/year over the duration of the study. When calculating power costs for the new servers, note that the loading of each server was already factored into the value produced by the power calculator. Assume that server maintenance costs will increase 3%/year over the duration of the study for all server maintenance agreements. The outside service contracts for security and storage will continue in the proposed scenario just as they were calculated in the current scenario. Assume that administrative costs on a virtual server are 50% of the administrative costs on a physical server. 1 administrative day is 10 hours long. 1 server day is 24 hours long. There are 365 days in one year. Administrative costs are currently $100/administrative hour. Assume that administrative costs will increase at the rate of 2%/year over the duration of the study. Project Two: Your Task Your first task for this project is to construct spreadsheets like the ones we discussed in class that will illustrate the current and proposed infrastructure costs for the IT4U given this proposed virtualization project. You should create (1) a variables spreadsheet(s) that includes all the variables defined in the project, (2) a current infrastructure cost spreadsheet, (3) a virtualization projected cost spreadsheet, and (4) a summary spreadsheet that highlights the major costs and benefits of the project. IMPORTANT!!! You must create your spreadsheet using variables to identify the various costs that are being tracked. In other words, don't hard code any numbers into the formulas in your spreadsheets. The following page illustrates one of the variables pages in my spreadsheet where I defined the variables used in current cost spreadsheets. You must include a similar page(s) in your spreadsheet. We'll cover this in the Q&A sessions. B D Variables Used In This Spreadsheet 1 Hard Costs 2 3 48 Value Variable Name Variable Description 5 6 7 8 num Servers Group1 numServersGroup2 numServersGroup3 numServersGroup4A numServersGroup4B GroupA consists of this many 3200w servers Group 2 consists of this many 3800W servers Group 3 consists of this many 2800W servers Group 4 A consists of this many 3800w servers - backup servers Group 4B consists of this many 2800W servers - backup servers power in watts of the servers in group 1 power in watts of the servers in group 2 2 power in watts of the servers in group 3 power in watts of the servers in group 4A power in watts of the servers in group 4B server PowerGroup1 server PowerGroup2 server Power Group3 server PowerGroup4A server PowerGroup4B serverLoad Group1 serverLoad Group2 serverLoadGroup3 server LoadGroup4A server Load Group4B 9 10 11 12 13 14 15 10 17 18 19 20 21 22 23 24 25 26 27 20 29 30 31 32 33 34 35 36 37 Soft Costs 38 39 40 41 maintenanceCost Year 1 Group 1 maintenanceCost Year 1 Group 2 maintenanceCost Year 1 Group3 maintenanceCost Year 1 Group4A maintenanceCost Year 1 Group4B average load of the servers in group 1 average load of the servers in group 2 average load of the servers in group 3 average load of servers in group 4A average load of servers in group 4B cost of maintenance contract year 1 - servers in group 1 cost of maintenance contract year 1 - servers in group 2 cost of maintenance contract year 1-servers in group 3 cost of maintenance contract year 1 - servers in group 4A cost of maintenance contract year 1 - servers in group 4B cost per month for security auditing service - outside vendor cost per month for storing archival backups - years 1 & 2 - outside vendor cost per month for storing archival backups - years 3,4 5 - outside vendor cost of 1 kwh or power in year 1 assume 2% increase in cost of power/year of study assume 3% increase in server maintenance cost each year of study security Firm MonthlyCharge dataStorageMonthlycharge Years1 And2 dataStorage MonthlyChargeYears3 Thrus costkwHYear1 power Ratelncrease maintenanceRatelncrease administrativeCost Per Hour Year 1 administrativeRatelncrease weeksAdministrative TimeGroup1 weeksAdministrative TimeGroup2 weeksAdministrative TimeGroup3 weeksAdministrative TimeGroup4A weeksAdministrativeTimeGroup4B cost of administrative time per hour in year 1 administrative pay increase amount weeks of administrative time per server Group 1 weeks of administrative time per server Group 12 weeks of administrative time per server Group 3 weeks of administrative time per server Group 4A weeks of administrative time per server Group 4B 42 43 44 45 46 47 48 49 SO 51 52 53 54 55 hoursPer BackupGroup1 hoursPer BackupGroup2 hoursPer Backup Group3 hoursPer Backup Group4A hoursPer BackupGroup4B hours per backup of server in Group 1 hours per backup of server in Group 2 hours per backup of server in Group 3 hours per backup of server in Group 4A hours per backup of server in Group 4B numberOfBackupsPer Year Group1 numberOfBackupsPer Year Group2 numberOfBackupsPer Year Group3 InumberOfBackupsPer Year Group4A number of backups performed on servers in Group 1 in 1 year number of backups performed on servers in Group 2 in 1 year number of backups performed on servers in Group 3 in 1 year Inumber of backups performed on servers in Group 4A in 1 vear Project Two: Your Task . Once your spreadsheets are completed, you'll construct a 1 page executive summary report of your findings. This report should address the feasibility of the proposed project and its financial impact on the IT4U. . an a more Normally, executive summary summarizes complete accompanying report. You will not be preparing this more complete report in this case, you will only be preparing the executive summary. Project Two: Your Task Note that an executive summary is different from an abstract. Abstracts tend to be most common in academic environments whereas executive summaries are primarily confined to business environments. An abstract is a brief summarizing statement which is read by people who are trying to decide whether or not to read the entire document. An executive summary is the document in miniature which can be read in place of the longer document. Project Two: Deliverables On or before 11:59 pm (WebCourses time) Sunday February 28, 2021 submit the following items via WebCourses: 1. A spreadsheet (similar to that we developed in the notes) with worksheets containing variable definitions, current cost infrastructure, proposed project cost infrastructure, and a summary worksheet. Use the spreadsheet template on WebCourses as the starting point for your project. 2. A one page executive summary of your findings with respect to the feasibility of this project for the IT4U. This executive summary should give an extremely brief overview of the proposed project, a summary of your findings (spreadsheet analysis results), and a recommendation of whether the project should move forward or not. CONSTANTS WORKSHEET These are numbers will are constants for both scenarios (current and proposed). Do not add any values here which vary between the two scenarios Value Variable Name Description number of hours in 1 administrative day number of hours in 1 administrative week number of hours in 1 year (24 hrs/day * 365 days/yr) number of months in a year number of weeks in a year number of days in 1 year number of watts in one kilowatt administrative cost for one hour in year 1 of study administrative pay increase awarded each year cost of 1 kwH or power in year 1 assume 2% increase in cost of power/year of study assume 3% increase in server maintenance cost each year of study CURRENT SCENARIO VARIABLES WORKSHEET Hard Costs Value Variable Name Variable Description GroupA consists of this many 3500W servers Group 2 consists of this many 4200W servers Group 3 consists of this many 2800W servers Group 4A consists of this many 3800W servers - backup servers Group 4B consists of this many 2800W servers - backup servers power in watts of the servers in group 1 power in watts of the servers in group 2 power in watts of the servers in group 3 power in watts of the servers in group 4A power in watts of the servers in group 4B average load of the servers in group 1 average load of the servers in group 2 average load of the servers in group 3 average load of servers in group 4A average load of servers in group 4B cost of maintenance contract year 1 - servers in group 1 cost of maintenance contract year 1 - servers in group 2 cost of maintenance contract year 1 - servers in group 3 cost of maintenance contract year 1-servers in group 4A cost of maintenance contract year 1-servers in group 48 cost per month for security auditing service - outside vendor cost per month for storing archival backups - years 1 & 2 - outside vendor cost per month for storing archival backups - years 3,45 - outside vendor Soft Costs Value Variable Name Variable Description administrative pay increase amount weeks of administrative time per server Group 1 weeks of administrative time per server Group 12 weeks of administrative time per server Group 3 weeks of administrative time per server Group 4A weeks of administrative time per server Group 4B hours per backup of server in Group 1 hours per backup of server in Group 2 hours per backup of server in Group 3 hours per backup of server in Group 4A hours per backup of server in Group 4B number of backups performed on servers in Group 1 in 1 year number of backups performed on servers in Group 2 in 1 year number of backups performed on servers in Group 3 in 1 year numberStep by Step Solution
There are 3 Steps involved in it
Step: 1

Get Instant Access to Expert-Tailored Solutions
See step-by-step solutions with expert insights and AI powered tools for academic success
Step: 2

Step: 3

Ace Your Homework with AI
Get the answers you need in no time with our AI-driven, step-by-step assistance
Get Started


