Question
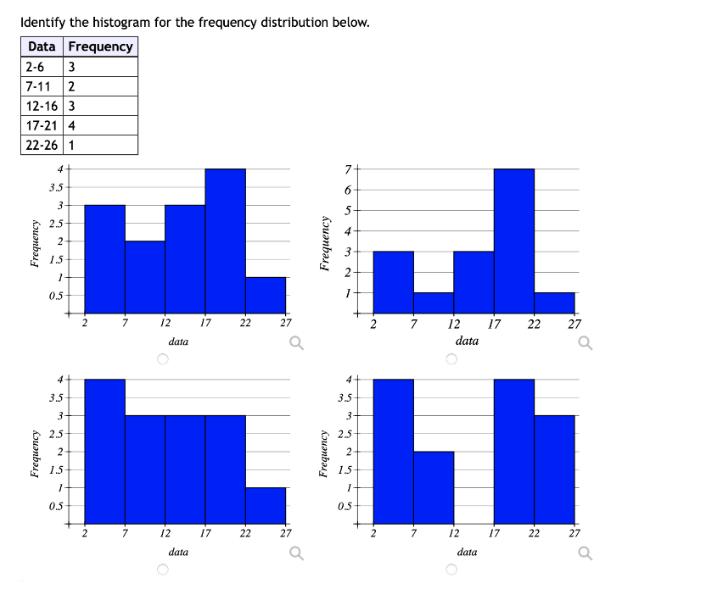
Identify the histogram for the frequency distribution below. Data Frequency 2-6 3 7-11 2 12-16 3 17-21 4 22-26 1 Frequency Frequency 4 3.5-

Identify the histogram for the frequency distribution below. Data Frequency 2-6 3 7-11 2 12-16 3 17-21 4 22-26 1 Frequency Frequency 4 3.5- 3- 2.5- 2 1.5 1- 0.5 4- 3.5 3- 2.5 2 1.5- 1 0.5 2 7 12 data 12 data 17 17 22 22 27 27 Frequency Frequency 7 6 5. A m N 4 3.5- 3- 2.5 2 15 1- 0.5 2 7 12 17 22 27 data 2 12 data 17 22 27 o
Step by Step Solution
3.54 Rating (151 Votes )
There are 3 Steps involved in it
Step: 1
The first interval 2 to 6 has 3 frequency value so the first bar in the ...
Get Instant Access to Expert-Tailored Solutions
See step-by-step solutions with expert insights and AI powered tools for academic success
Step: 2

Step: 3

Ace Your Homework with AI
Get the answers you need in no time with our AI-driven, step-by-step assistance
Get StartedRecommended Textbook for
System Dynamics
Authors: William Palm III
3rd edition
73398063, 978-0073398068
Students also viewed these Accounting questions
Question
Answered: 1 week ago
Question
Answered: 1 week ago
Question
Answered: 1 week ago
Question
Answered: 1 week ago
Question
Answered: 1 week ago
Question
Answered: 1 week ago
Question
Answered: 1 week ago
Question
Answered: 1 week ago
Question
Answered: 1 week ago
Question
Answered: 1 week ago
Question
Answered: 1 week ago
Question
Answered: 1 week ago
Question
Answered: 1 week ago
Question
Answered: 1 week ago
Question
Answered: 1 week ago
Question
Answered: 1 week ago
Question
Answered: 1 week ago
Question
Answered: 1 week ago
Question
Answered: 1 week ago
Question
Answered: 1 week ago
Question
Answered: 1 week ago
Question
Answered: 1 week ago
View Answer in SolutionInn App


