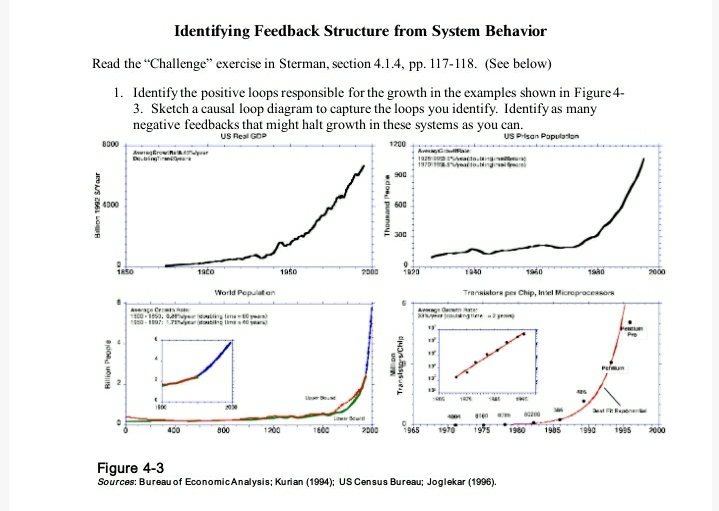
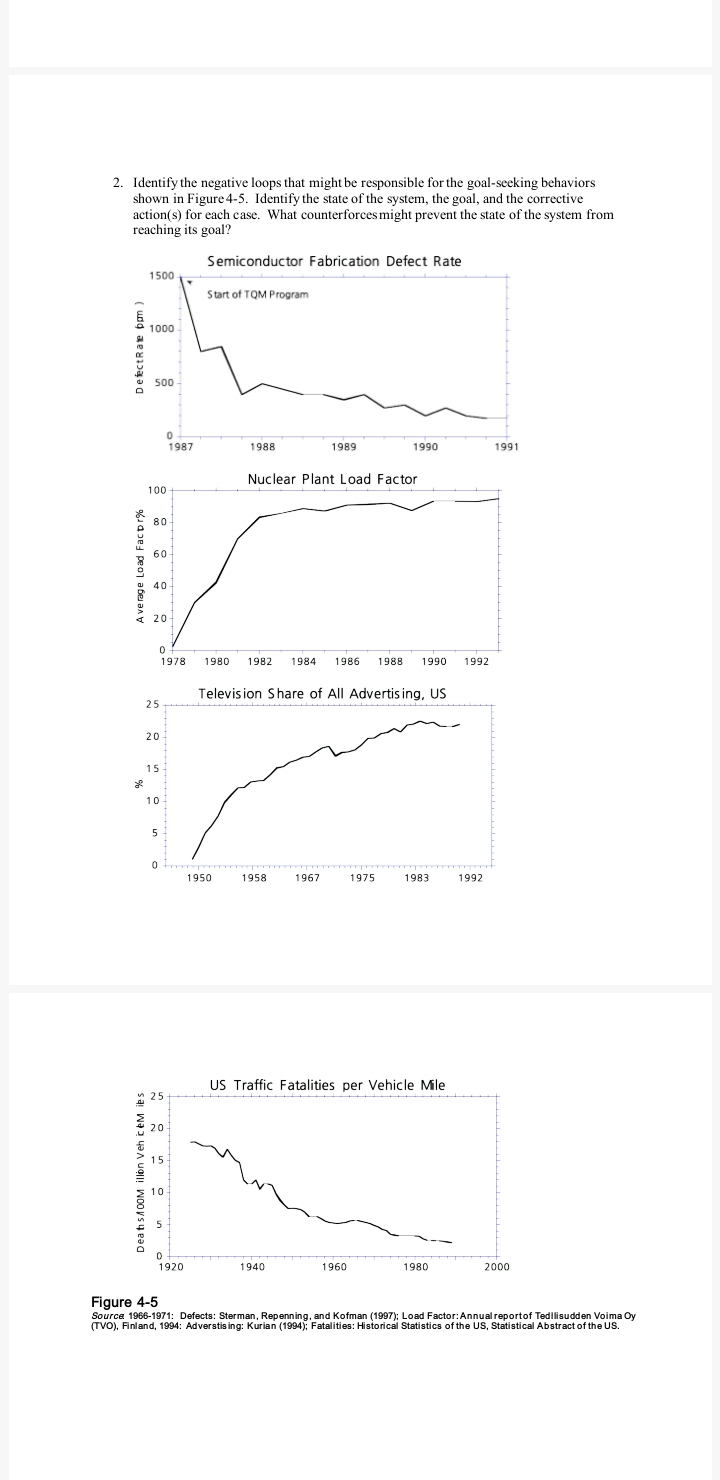
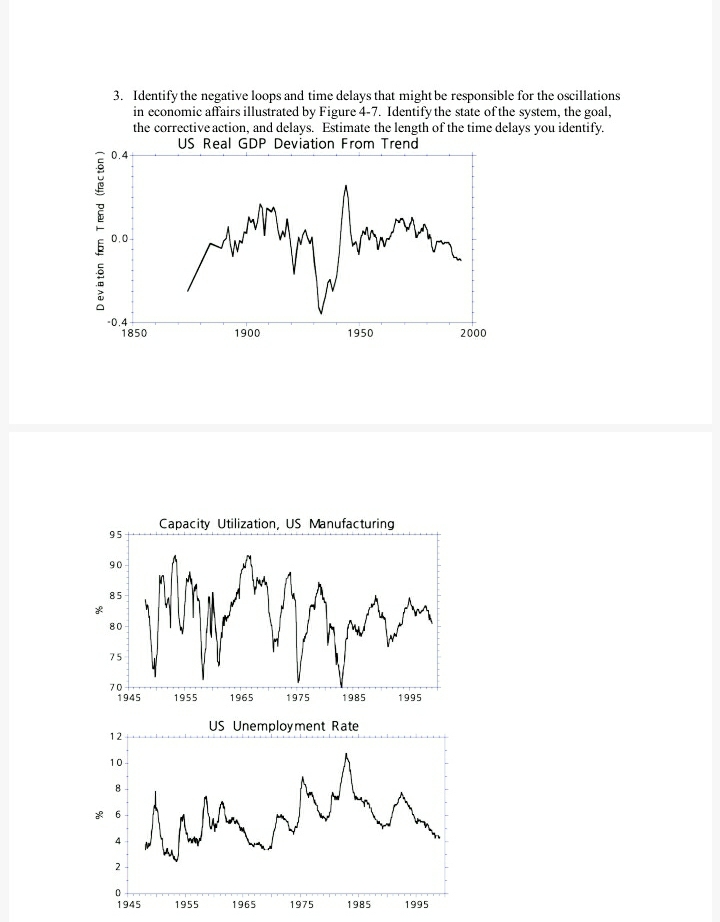
Identifying Feedback Structure from System Behavior Read the "Challenge" exercise in Sterman, section 4.1.4, pp. 117-118. (See below) 1. Identify the positive loops responsible for the growth in the examples shown in Figure 4- 3. Sketch a causal loop diagram to capture the loops you identify. Identify as many negative feedbacks that might halt growth in these systems as you can. 6000 US Real GOP 1200 US Prison Population Billion 1992 5/Year 4000 I hounand Poops 1050 1020 World Population Transistors per Chip, Intel Microprocessors Billion People Transling S Chip 800 1260 1608 2508 1965 1970 1975 19 00 1905 390 1935 30:00 Figure 4-3 Sources: Bureau of EconomicAnalysis; Kurian (1984); US Census Bureau; Joglekar (1996).2. Identify the negative loops that might be responsible for the goal-seeking behaviors shown in Figure 4-5. Identify the state of the system, the goal, and the corrective action(s) for each case. What counterforces might prevent the state of the system from reaching its goal? Semiconductor Fabrication Defect Rate 1500 DefectRate bp ) Start of TOM Program 1000 500 1987 1988 1989 1990 1991 100 Nuclear Plant Load Factor Average Load Factor% 80 60 40 20 1978 1980 1982 1984 1986 1988 1990 1992 25 Television Share of All Advertising, US 20- 15 4 32 10 4 1950 1958 1967 1975 1983 1992 DeatisAOOM illon Veh ceM ies 25+ US Traffic Fatalities per Vehicle Mile 20 5 10 5 1920 1940 1960 1980 2000 Figure 4-5 Source 1966-1971: Defects: Sterman, Repenning, and Kofman (1997); Load Factor: Annual reportof Tedllisudden Voima Oy (TVO), Finland, 1994: Adverstising: Kurian (1994); Fatalities: Historical Statistics of the US, Statistical Abstract of the US.3. Identify the negative loops and time delays that might be responsible for the oscillations in economic affairs illustrated by Figure 4-7. Identify the state of the system, the goal, the corrective action, and delays. Estimate the length of the time delays you identify. Devaton for Trend (fraction ) 0.4 US Real GDP Deviation From Trend 0.0 -0.4 1850 1900 1950 2000 95+ Capacity Utilization, US Manufacturing 75 70+ 1945 1955 1965 1975 1985 1995 12 US Unemployment Rate 10 N 1945 1955 1965 1975 1985 1995


