Answered step by step
Verified Expert Solution
Question
1 Approved Answer
If we explicitly apply the cubic polynomial svm to the original 7 8 4 - dimensional raw pixel features, the resulting representation would be of
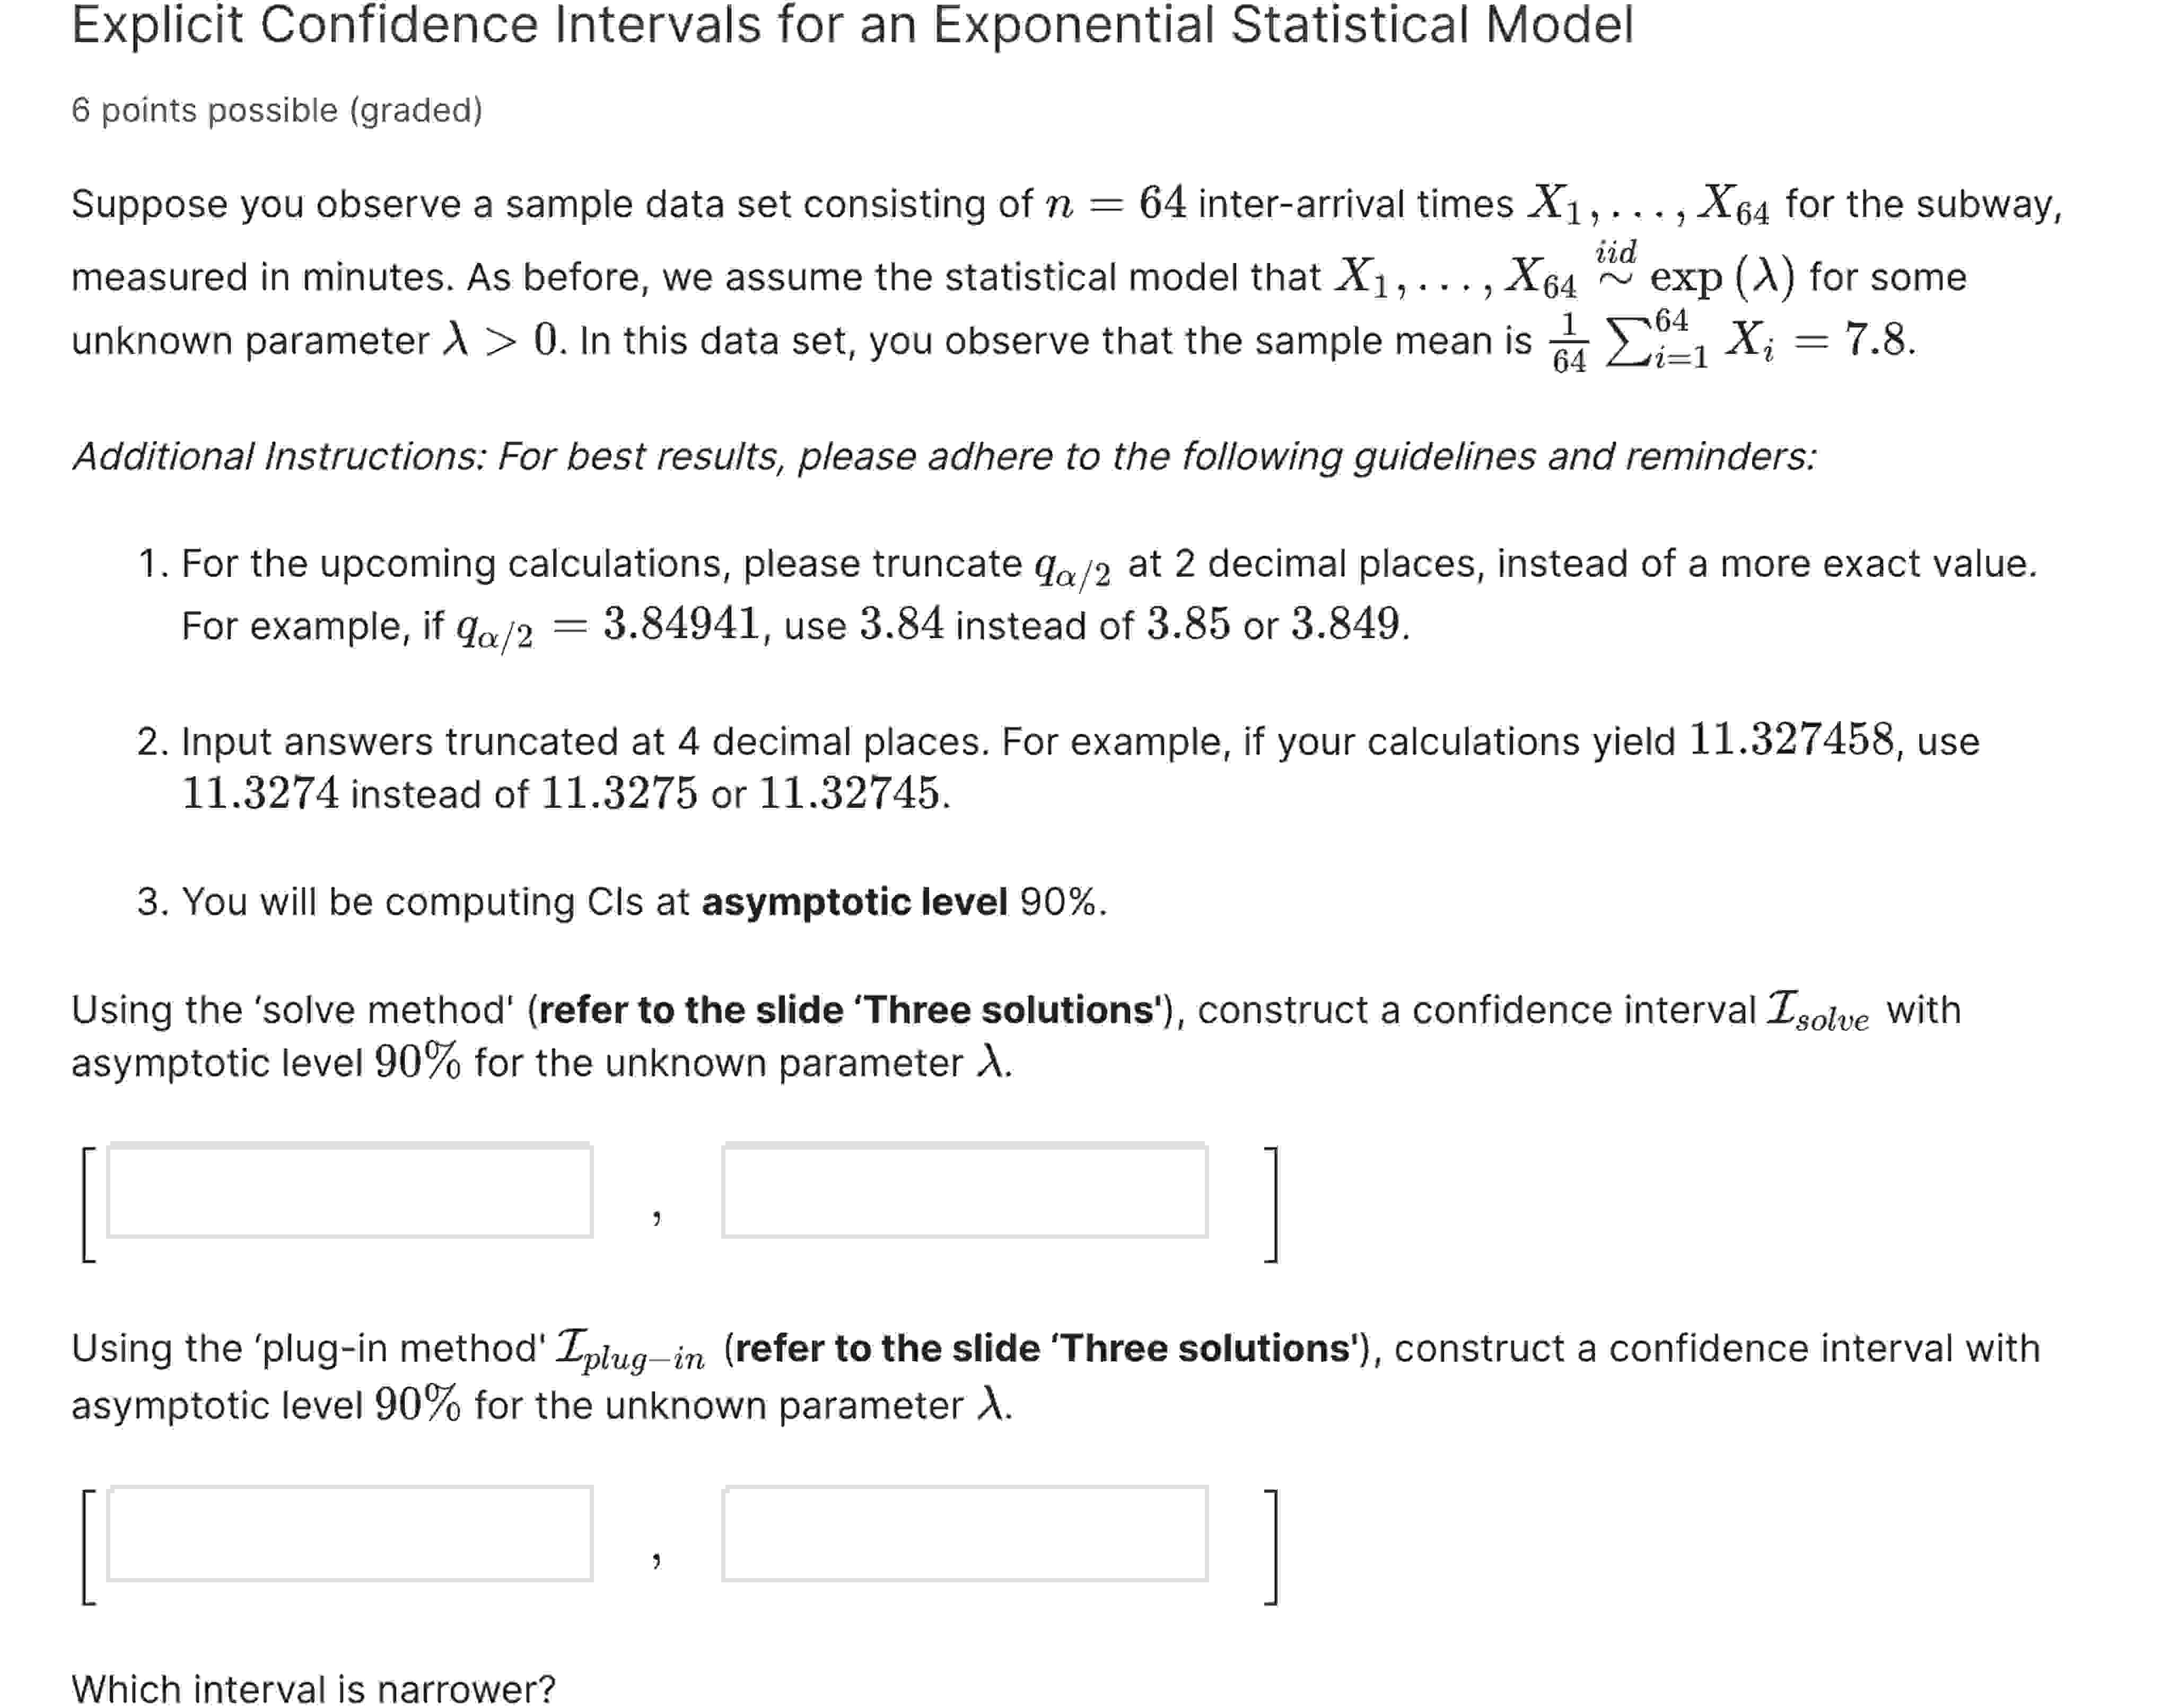
If we explicitly apply the cubic polynomial svm to the original dimensional raw pixel features, the resulting representation would be of massive dimensionality. Instead, we will apply the cubic polynomial svm to the dimensional PCA representation of our training data which we will have to calculate just as we calculated the dimensional representation in the previous problem. Use the sklearn package and build the SVM model on your local machine. Use randomstate kernel 'poly', degree and default values for other parameters. If you have done everything correctly, cubic polynomial svm should perform better on the test set using these features than either the dimensional principal components or raw pixels. The error on the test set using the cubic polynomial svm should only be around demonstrating the power of nonlinear classification models. Error rate for dimensional PCA features using cubic polynomial svm Explicit Confidence Intervals for an Exponential Statistical Model
points possible graded
Suppose you observe a sample data set consisting of interarrival times dots, for the subway,
measured in minutes. As before, we assume the statistical model that dots,exp for some
unknown parameter In this data set, you observe that the sample mean is
Additional Instructions: For best results, please adhere to the following guidelines and reminders:
For the upcoming calculations, please truncate at decimal places, instead of a more exact value.
For example, if use instead of or
Input answers truncated at decimal places. For example, if your calculations yield use
instead of or
You will be computing Cls at asymptotic level
Using the 'solve method' refer to the slide 'Three solutions' construct a confidence interval with
asymptotic level for the unknown parameter
Using the 'plugin method' refer to the slide 'Three solutions' construct a confidence interval with
asymptotic level for the unknown parameter
Which interval is narrower?

Step by Step Solution
There are 3 Steps involved in it
Step: 1

Get Instant Access to Expert-Tailored Solutions
See step-by-step solutions with expert insights and AI powered tools for academic success
Step: 2

Step: 3

Ace Your Homework with AI
Get the answers you need in no time with our AI-driven, step-by-step assistance
Get Started


