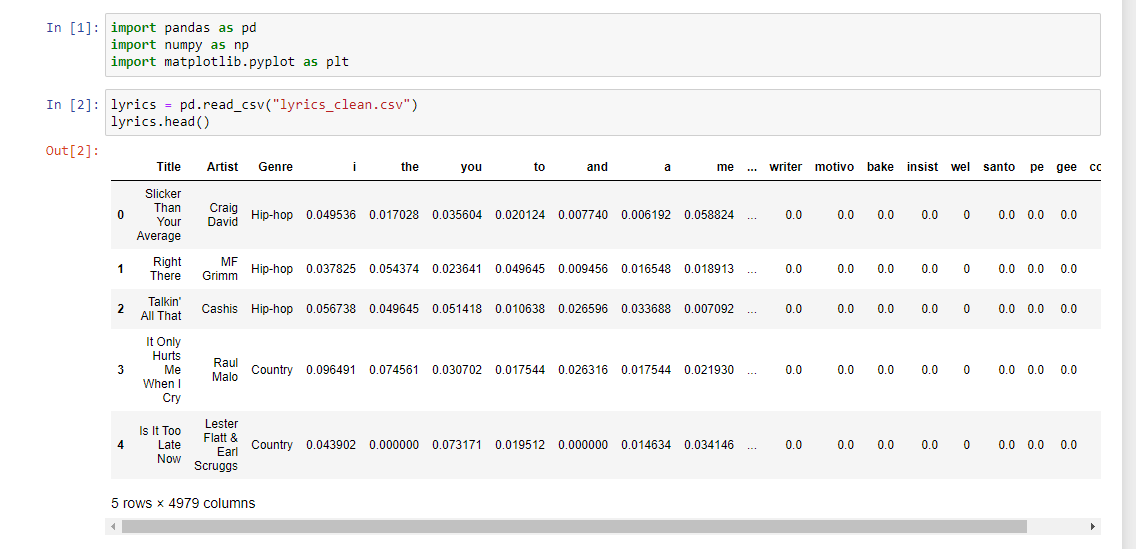
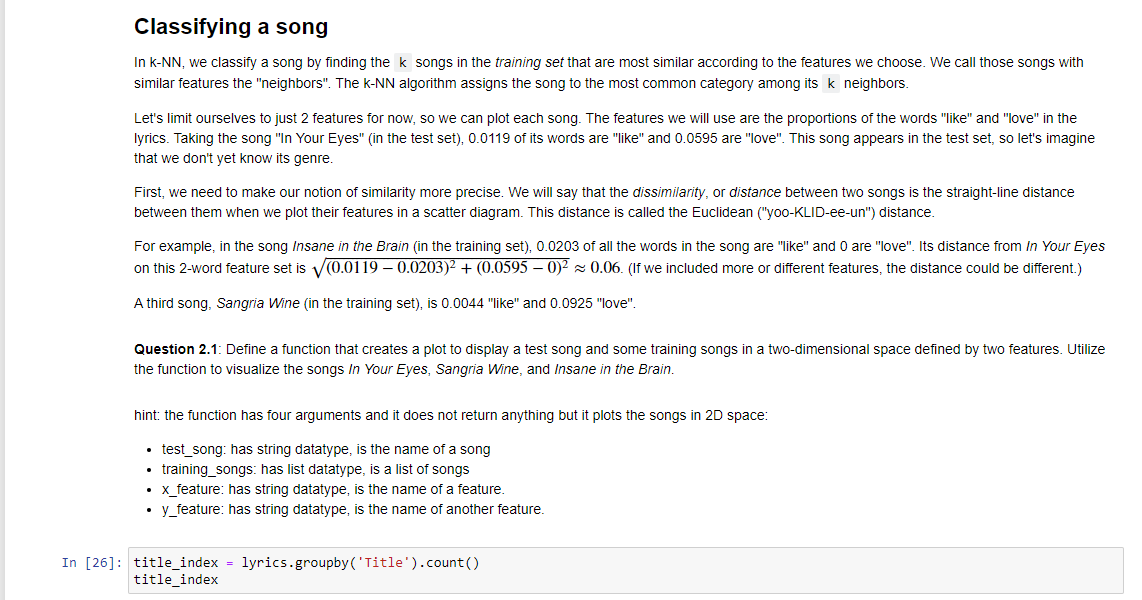
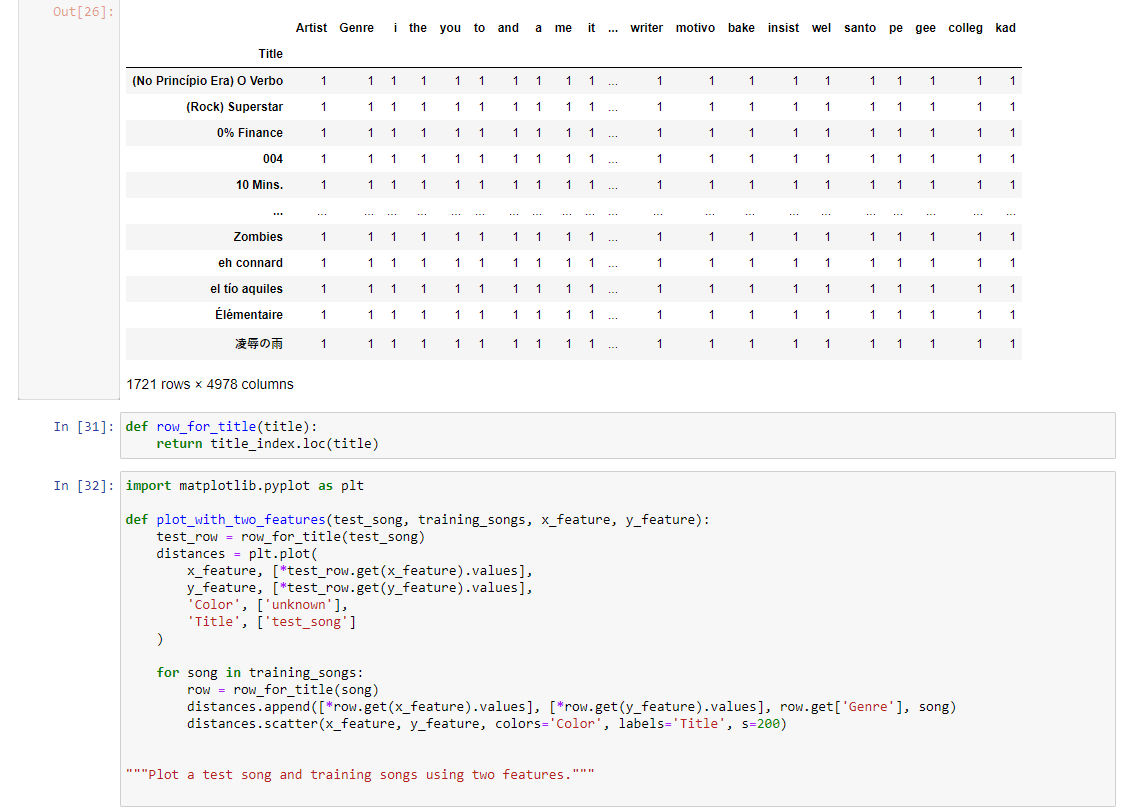
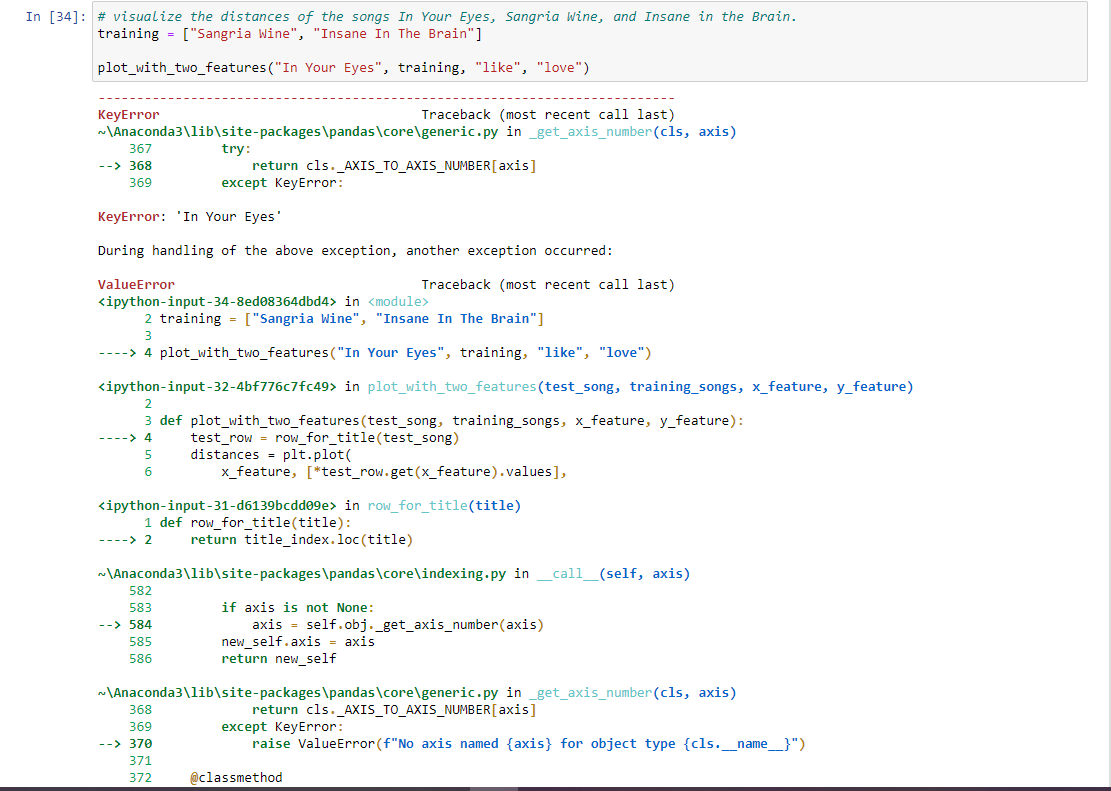
In [1] : import pandas as pd import numpy as np import matplotlib. pyplot as plt In [2]: lyrics = pd. read_csv("lyrics_clean.csv") lyrics. head ( ) Out [2 ] : Title Artist Genre the you to and a me ... writer motivo bake insist wel santo pe gee cc Slicker 0 Than Craig Your David Hip-hop 0.049536 0.017028 0.035604 0.020124 0.007740 0.006192 0.058824 ... 0.0 0.0 0.0 0.0 0 0.0 0.0 0.0 Average Right MF There Hip-hop 0.037825 0.054374 0.023641 0.049645 0.009456 0.016548 0.018913 ... 0.0 Grimm 0.0 0.0 0.0 0 0.0 0.0 0.0 2 Talkin' All That Cashis Hip-hop 0.056738 0.049645 0.051418 0.010638 0.026596 0.033688 0.007092 ... 0.0 0.0 0.0 0.0 0 0.0 0.0 0.0 It Only Hurts 3 Me Raul When I Malo Country 0.096491 0.074561 0.030702 0.017544 0.026316 0.017544 0.021930 ... 0.0 0.0 0.0 0.0 0 0.0 0.0 0.0 Cry Is It Too Lester 4 Late Flatt & Earl Country 0.043902 0.000000 0.073171 0.019512 0.000000 0.014634 0.034146 ... 0.0 0.0 0.0 0.0 0 0.0 0.0 0.0 Now Scruggs 5 rows x 4979 columnsIn [26]: Classifying a song In kNN, we classify a song by nding the k songs in the training set that are most similar according to the features we choose. We call those songs with similar features the "neighbors". The kNN algorithm assigns the song to the most common category among its k neighbors. Let's limit ourselves to just 2 features for now, so we can plot each song. The features we will use are the proportions of the words "like" and "love" in the Iyncs. Taking the song "In Your Eyes" (in the test set), 0.0119 of its words are "like" and 00595 are "love". This song appears in the test set, so let's imagine that we don't yet Know its genre. First, we need to make our notion of similarity more precise. We will say that the dissimilarity, or distance between two songs is the straightline distance between them when we plot their features in a scatter diagram. This distance is called the Euclidean ('yooKLIDeeun") distance. For example, in the song insane in the Brain (in the training set}, 0.0203 of all the words in the song are "like" and 0 are "love". Its distance from in Your Eyes on this 2word feature set is (0.0119 0.0203)2 + (0.0595 0)2 m 0.06. (If we included more or different features, the distance could be different.) A third song, Sangria Wine (in the training set), is 0.0044 "like" and 0.0925 "love". Question 2.1: Dene a function that creates a plot to display a test song and some training songs in a twooimensional space dened by two features. Utilize the function to visualize the songs in Your Eyes, Sangria Wine, and insane in the Brain. hint: the function has four arguments and it does not return anything but it plots the songs in 2D space: - test_song: has string datatype, is the name of a song - training_songs: has list dalatype, is a list of songs - x_feature: has slIing datatype, is the name of a feature. - y_feature: has slIing datatype, is the name of another feature. tit1e_index = lynics.gr'oupby( 'Title ') .count() tit1e_index Out [ 26] : Artist Genre i the you to and a me it ... writer motivo bake insist wel santo pe gee collegekad Title 1 1 (No Principio Era) O Verbo (Rock) Superstar 1 0% Finance 1 1 1 1 004 1 1 1 .. . 10 Mins. .. . .. . ... .. . . . . .. . . . . . . . ... ... . . . .. . .-. .-. . . . .. . 1 1 1 1 1 1 1 ... Zombies 1 1 1 1 1 1 1 .. . eh connard 1 1 1 1 1 1 1 1 1 1 ... el tio aquiles 1 1 1 1 1 1 1 1 1 1 ... Elementaire 1 1 1 1 ... 1721 rows x 4978 columns In [31]: def row_for_title(title): return title_index. loc(title) In [32]: import matplotlib. pyplot as plt def plot_with_two_features (test_song, training_songs, x_feature, y_feature): test_row = row_for_title(test_song) distances = plt. plot( x_feature, [*test_row. get(x_feature) . values], y_feature, [*test_row.get(y_feature) . values], 'Color' , [' unknown' ], Title' , ['test_song' ] for song in training_songs: now = now_for_title (song) distances . append ([*row. get (x_feature) . values], [*row. get(y_feature) . values], row. get[ 'Genre' ], song) distances . scatter(x_feature, y_feature, colors='Color', labels='Title', s=200) """Plot a test song and training songs using two features."""In [34]: # visualize the distances of the songs In Your Eyes, Sangria Wine, and Insane in the Brain. training = ["Sangria Wine", "Insane In The Brain" ] plot_with_two_features("In Your Eyes", training, "like", "love") KeyError Traceback (most recent call last) ~\\Anaconda3\\lib\\site-packages\\pandas\\core\\generic . py in _get_axis_number(cls, axis) 367 try: 368 return cls. _AXIS_TO_AXIS_NUMBER[axis ] 369 except KeyError: KeyError: 'In Your Eyes' During handling of the above exception, another exception occurred: ValueError Traceback (most recent call last)
in 2 training = ["Sangria Wine", "Insane In The Brain"] 3 ----> 4 plot_with_two_features("In Your Eyes", training, "like", "love") in plot_with_two_features (test_song, training_songs, x_feature, y_feature) 3 def plot_with_two_features (test_song, training_songs, x_feature, y_feature): test_row = row_for_title(test_song) distances = plt. plot( x_feature, [*test_row. get(x_feature) . values], in row_for_title(title) 1 def row_for_title(title): 2 return title_index. loc(title) ~\\Anaconda3\\lib\\site-packages\\pandas \\core\\indexing . py in _call_(self, axis) 582 583 if axis is not None: 584 axis = self. obj._get_axis_number(axis) 585 new_self . axis = axis 586 return new_self ~\\Anaconda3\\lib\\site-packages \\pandas\\core\\generic . py in _get_axis_number(cls, axis) 368 return cls. _AXIS_TO_AXIS_NUMBER[axis ] 369 except KeyError: 370 raise ValueError (f"No axis named {axis} for object type {cls._name_}") 371 372 @classmethod