Question
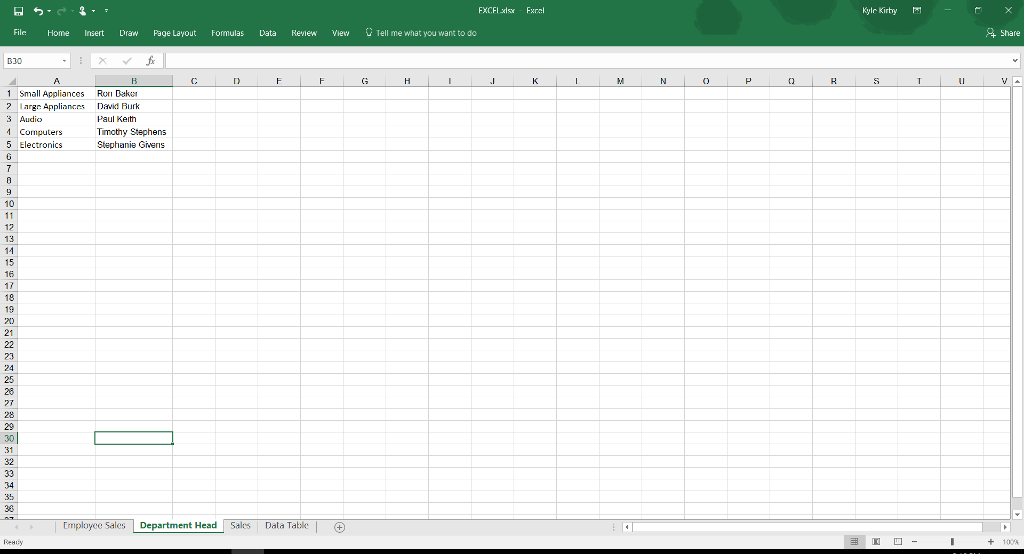
In cell G7, create a vlookup formula to look up and return the department head names for each department. You will find the department heads
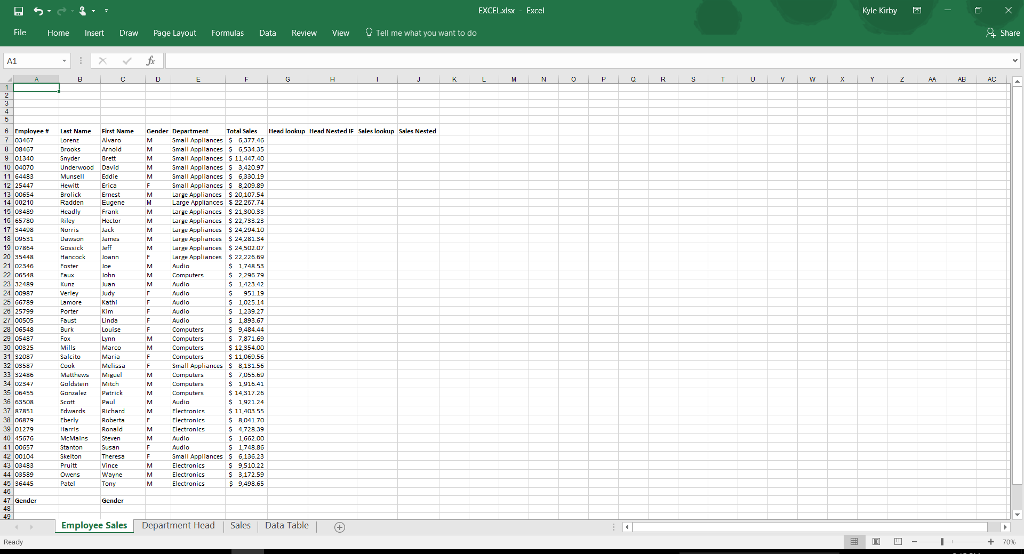
In cell G7, create a vlookup formula to look up and return the department head names for each department. You will find the department heads listed on the Department Head sheet (Remember that vlookup tables need to be sorted). Copy and paste the formula down the rest of the database giving the proper results.
In cell H7, create a nested if formula that will give the same results as the previous vlookup formula. Copy and paste the formula down the rest of the database.
On the Sales Sheet (It is blank). Create a lookup table. In the first column there should be the values to setup the different categories based on Total Sales. Anything less than $3000 is considered Low Sales. Anything greater than $3000 but less than $7000 is considered OK Sales. Anything greater than $7000 but less than $11000 is considered Average Sales. Anything greater than $11000 but less than $15000 is considered Above Average Sales. Anything Greater than $15000 is considered Excellent Sales.
On the Employee Sales Sheet, in I7, created a vlookup formula to determine which category of Sales the employee fell into (Use the lookup table you just created). After you have completed this formula, copy and paste it down through the rest of the database.
In cell J7, create a nested if that will give the same results as the vlookup formula you just created in the previous question. Copy and paste the formula down through the rest of the database.
In cell L1 use the Unique Records only feature of the data filter, and list the departments found in the database. There should be 5 departments listed.
Starting in Cell N1, run a data filter that will filter out the Employee # and Total Sales for the employees found in the Computer Department. Create your criteria Range starting in cell G1.
In cell F46, create a formula to calculate the Total Sales. (Hint: Sum)
In cell F47, create a formula to give the largest Sales Figure in the database. (Hint: Max)
From your Unique Records only Filter in number 9, copy and paste the results starting in Cell A5 on the Data Table Sheet.
Create a one variable Data Table from what you just copied and pasted giving the average sales for each department, and the Largest Sale from each department. (Hint: Daverage and Dmax and create your criteria range starting in Cell A1)
On the Data table Sheet. Create a 2 variable data table starting in Cell A20 giving the Average Sales for each department by Gender. Start your Criteria Range in cell A15. (Hint: DAverage and the criteria range should include Department and Gender).
On the Employee Sales sheet, in Cell A52, create a formula to calculate the total sales by Males. Use the criteria range in cells A47:A48.
On the Employee Sales sheet, in cell C52, create a formula to calculate the total sales by Females. Use the criteria range in Cells C47:C48.


Step by Step Solution
There are 3 Steps involved in it
Step: 1

Get Instant Access to Expert-Tailored Solutions
See step-by-step solutions with expert insights and AI powered tools for academic success
Step: 2

Step: 3

Ace Your Homework with AI
Get the answers you need in no time with our AI-driven, step-by-step assistance
Get Started


