Question
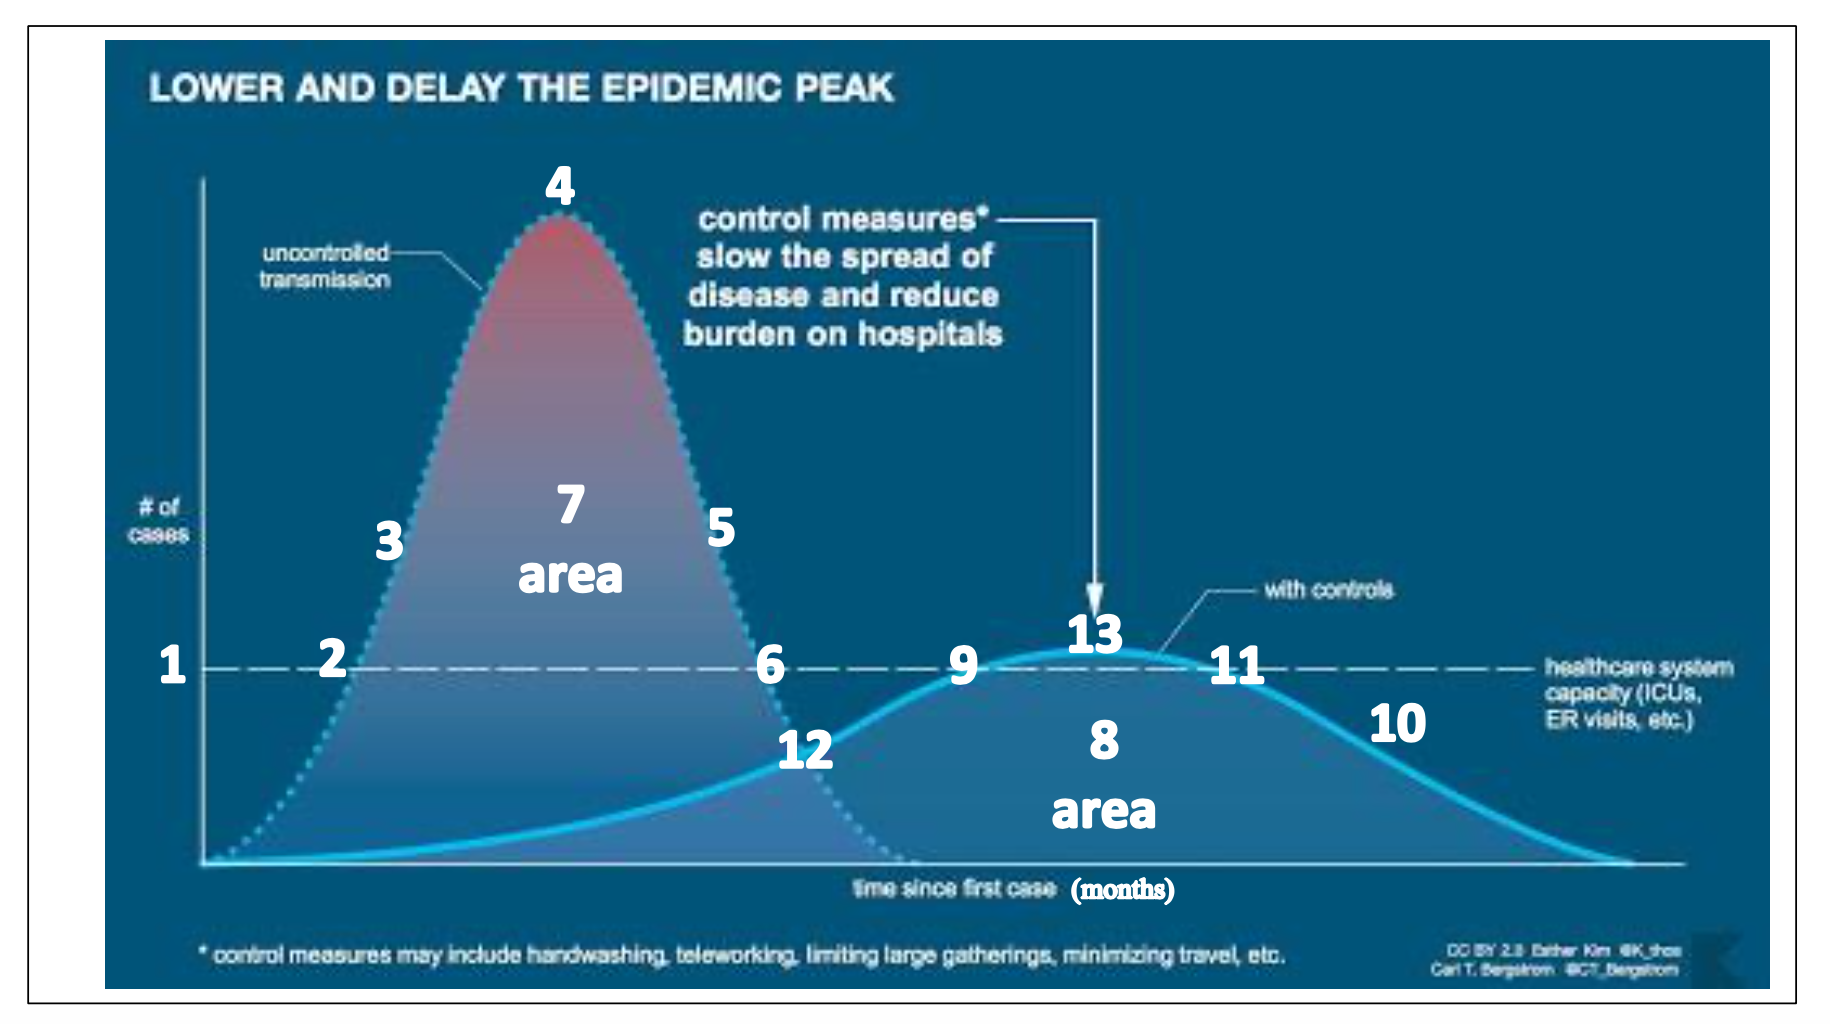
In complete sentences, explain what each of the 13 numbered selections on the graph above mean in the context of the cases of Coronavirus 19.
 In complete sentences, explain what each of the 13 numbered selections on the graph above mean in the context of the cases of Coronavirus 19. Be sure to include the proper units of measure and speak to each mathematical concept listed below.
-
Output value
-
Input & Output values
-
Point of inflection, rate of change, 1st and 2nd derivatives
-
Extrema, rate of change, 1st and 2nd derivative
-
Point of inflection, rate of change, 1st and 2nd derivatives
6. Input & Output values
7. Area
8. Area
-
Input & Output values
-
Point of inflection, rate of change, 1st and 2nd derivatives
-
Input & Output values
-
Point of inflection, rate of change, 1st and 2nd derivatives
-
Extrema, rate of change, 1st and 2nd derivatives
-
How would you compare the areas of 7 and 8 in terms of their relative sizes and what does
that mean about the number of cases of Coronavirus-19 using the two models? Despite your answer, explain why health care professionals still prefer the controlled model?
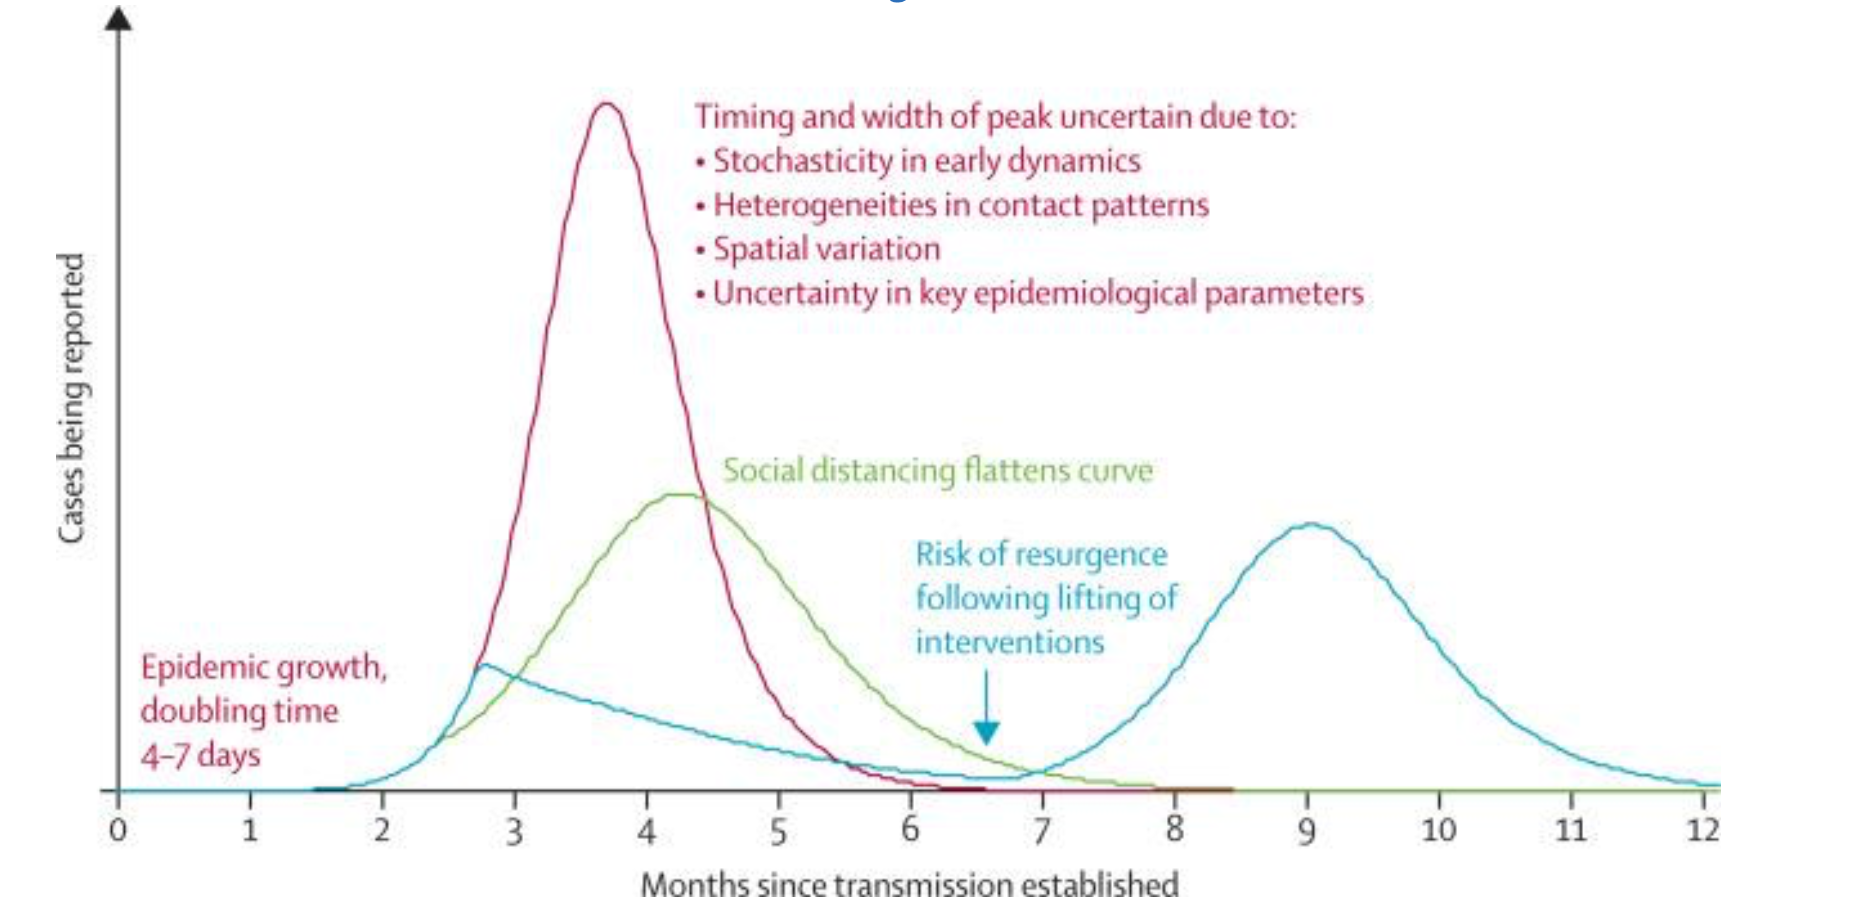
15. Compare and contrast the blue mathematical model with the red (individual case isolation) and green (social distancing) models for the spread of COVID-19. What is the danger of lifting control measures too soon when dealing with infectious diseases?

Step by Step Solution
There are 3 Steps involved in it
Step: 1

Get Instant Access to Expert-Tailored Solutions
See step-by-step solutions with expert insights and AI powered tools for academic success
Step: 2

Step: 3

Ace Your Homework with AI
Get the answers you need in no time with our AI-driven, step-by-step assistance
Get Started


