In JAVA

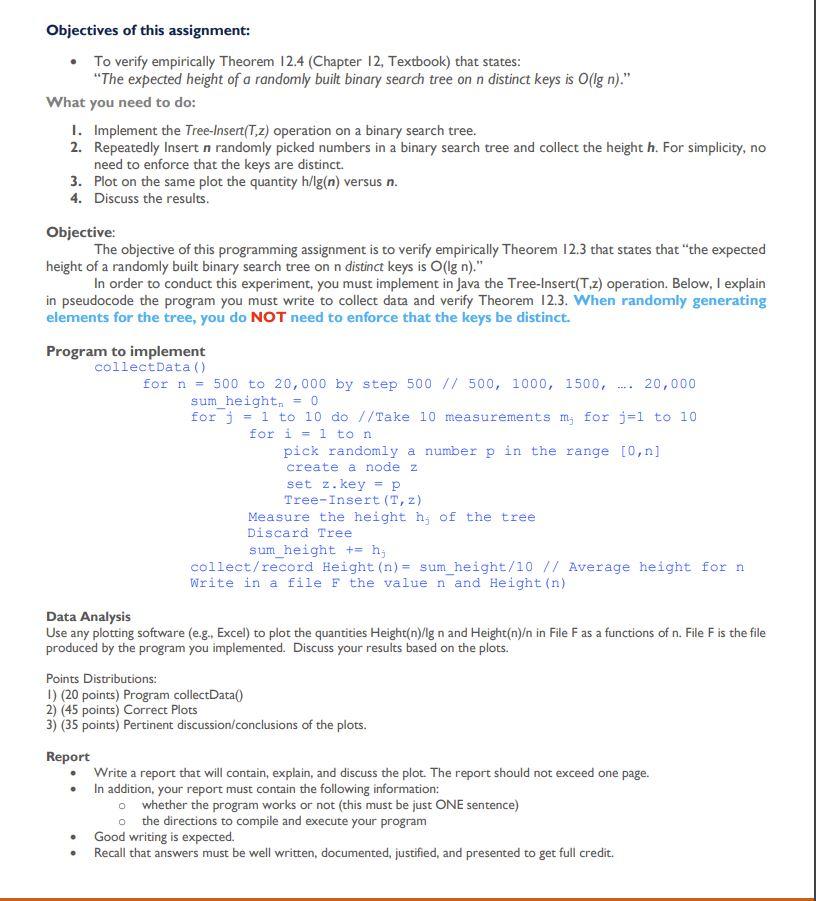
Objectives of this assignment: To verify empirically Theorem 12.4 (Chapter 12, Textbook) that states: "The expected height of a randomly built binary search tree on n distinct keys is O(lg n)." What you need to do: 1. Implement the Tree-Insert(T.z) operation on a binary search tree. 2. Repeatedly Insert n randomly picked numbers in a binary search tree and collect the height h. For simplicity, no need to enforce that the keys are distinct. 3. Plot on the same plot the quantity h/g(n) versus n. 4. Discuss the results Objective: The objective of this programming assignment is to verify empirically Theorem 12.3 that states that "the expected height of a randomly built binary search tree on n distinct keys is O(lg n)." In order to conduct this experiment, you must implement in Java the Tree-Insert(T.2) operation. Below, I explain in pseudocode the program you must write to collect data and verify Theorem 12.3. When randomly generating elements for the tree, you do NOT need to enforce that the keys be distinct. Program to implement collectData() for n = 500 to 20,000 by step 500 // 500, 1000, 1500, 20,000 sum_height, for j = 1 to 10 do //Take 10 measurements mj for j=1 to 10 = 1 ton pick randomly a number p in the range [0,n] create a node 2 set z. key = P Tree-Insert (T, 2) Measure the height n; of the tree Discard Tree sum height += h; collect/record Height (n)= sum_height/10 // Average height for n Write in a file F the value n and Height (n) Data Analysis Use any plotting software (eg., Excel) to plot the quantities Height(n)/gn and Height(n) in File F as a functions of n. File F is the file produced by the program you implemented. Discuss your results based on the plots. Points Distributions: 1) (20 points) Program collectData() 2) (45 points) Correct Plots 3) (35 points) Pertinent discussion/conclusions of the plots. = 0 for i Report Write a report that will contain, explain, and discuss the plot. The report should not exceed one page. In addition, your report must contain the following information: o whether the program works or not (this must be just ONE sentence) o the directions to compile and execute your program Good writing is expected. Recall that answers must be well written, documented, justified, and presented to get full credit


