

Answered step by step
Verified Expert Solution
Question
1 Approved Answer
In R programming, make the y labels show up as 60s, 40s, 20s. Make this appear with and without ggplot Returns: Tracked and Untracked Customers
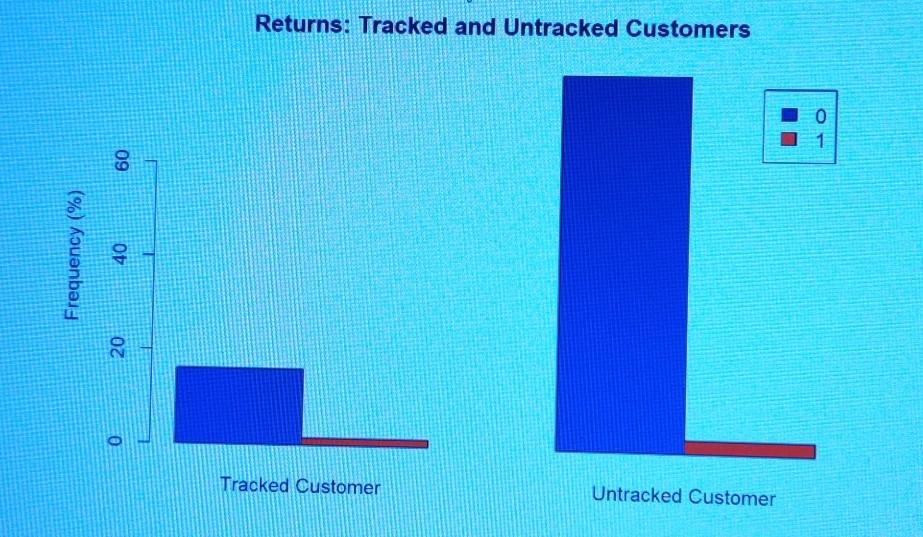
In R programming, make the y labels show up as 60s, 40s, 20s. Make this appear with and without ggplot
Returns: Tracked and Untracked Customers 0 1 1 60 Frequency (%) 40 20 o Tracked Customer Untracked CustomerStep by Step Solution
There are 3 Steps involved in it
Step: 1

Get Instant Access to Expert-Tailored Solutions
See step-by-step solutions with expert insights and AI powered tools for academic success
Step: 2

Step: 3
Ace Your Homework with AI
Get the answers you need in no time with our AI-driven, step-by-step assistance
Get Started
The Database Management Systems
Authors: Patricia Ward, George A Dafoulas
1st Edition
1844804526, 978-1844804528