

Question: In the Base Model (with WIP= 4 units, Mean Daily production = 3.5, Maximum Variation Around Mean =2.5 units at all operations), a bottleneck
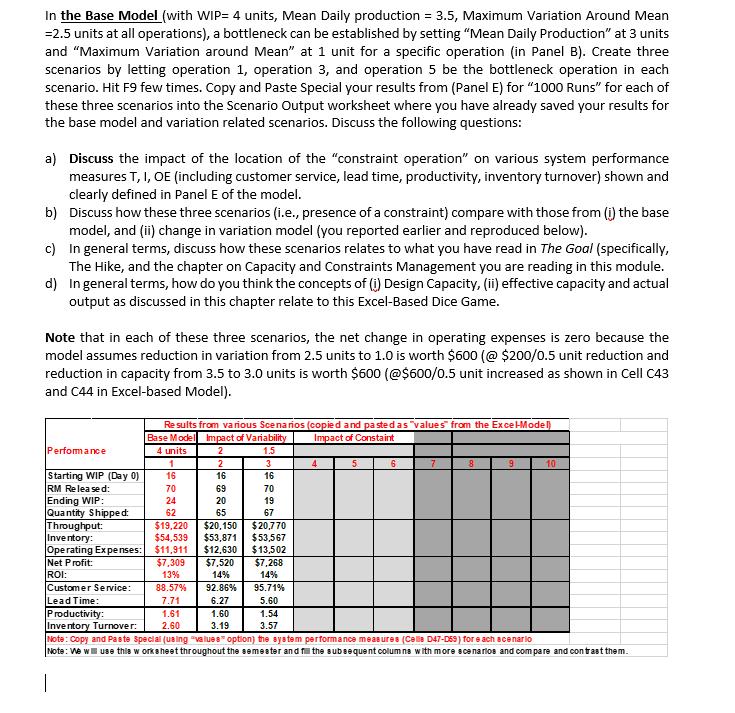
In the Base Model (with WIP= 4 units, Mean Daily production = 3.5, Maximum Variation Around Mean =2.5 units at all operations), a bottleneck can be established by setting "Mean Daily Production" at 3 units and "Maximum Variation around Mean" at 1 unit for a specific operation (in Panel B). Create three scenarios by letting operation 1, operation 3, and operation 5 be the bottleneck operation in each scenario. Hit F9 few times. Copy and Paste Special your results from (Panel E) for "1000 Runs" for each of these three scenarios into the Scenario Output worksheet where you have already saved your results for the base model and variation related scenarios. Discuss the following questions: a) Discuss the impact of the location of the "constraint operation" on various system performance measures T, I, OE (including customer service, lead time, productivity, inventory turnover) shown and clearly defined in Panel E of the model. b) Discuss how these three scenarios (i.e., presence of a constraint) compare with those from (i) the base model, and (ii) change in variation model (you reported earlier and reproduced below). c) In general terms, discuss how these scenarios relates to what you have read in The Goal (specifically, The Hike, and the chapter on Capacity and Constraints Management you are reading in this module. In general terms, how do you think the concepts of (i) Design Capacity, (ii) effective capacity and actual output as discussed in this chapter relate to this Excel-Based Dice Game. d) Note that in each of these three scenarios, the net change in operating expenses is zero because the model assumes reduction in variation from 2.5 units to 1.0 is worth $600 (@ $200/0.5 unit reduction and reduction in capacity from 3.5 to 3.0 units is worth $600 (@$600/0.5 unit increased as shown in Cell C43 and C44 in Excel-based Model). Performance 1 16 70 24 62 $19,220 $20,150 $20,770 $54,539 $53,871 $53,567 $11,911 $12,630 $13,502 $7,309 $7,520 $7,268 13% 14% 14% Customer Service: 88.57% 92.86% Lead Time: 7.71 6.27 Productivity: 1.61 Inventory Turnover: 2.60 Starting WIP (Day 0) RM Released: Ending WIP: Quantity Shipped: Throughput: Inventory: Operating Expenses: Results from various scenarios (copied and pasted as "values" from the Excel-Model) Base Model Impact of Variability Impact of Constaint 4 units 2 1.5 2 Net Profit: ROI: 16 69 20 65 1.60 3.19 3 16 70 19 67 95.71% 5.60 1.54 3.57 4 5 6 7 8 9 10 Note: Copy and Paste Special (using"values" option) the system performance measures (Celle D47-D59) for each scenario Note: We will use this worksheet throughout the semester and fill the subsequent columns with more scenarios and compare and contrast them.
Step by Step Solution
3.45 Rating (155 Votes )
There are 3 Steps involved in it
a Discuss the impact of the location of the constraint operation on various system performance measures T I OE including customer service lead time productivity inventory turnover shown and clearly de... View full answer

Get step-by-step solutions from verified subject matter experts