

Answered step by step
Verified Expert Solution
Question
1 Approved Answer
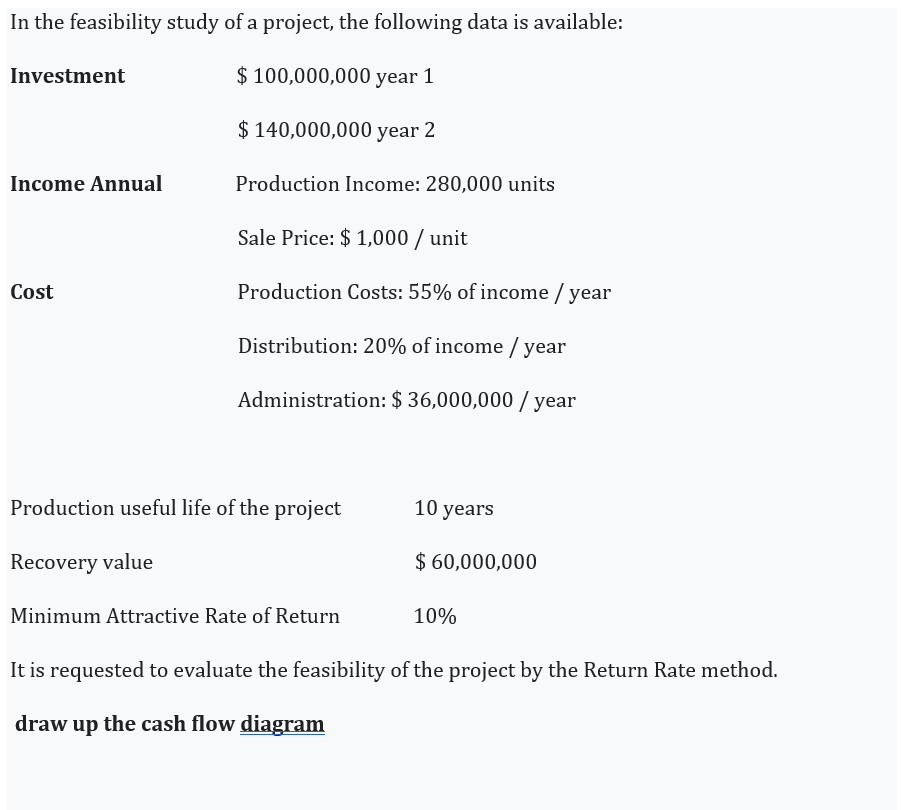
In the feasibility study of a project, the following data is available: Investment $ 100,000,000 year 1 $ 140,000,000 year 2 Income Annual Production Income:
Step by Step Solution
There are 3 Steps involved in it
Step: 1

Get Instant Access to Expert-Tailored Solutions
See step-by-step solutions with expert insights and AI powered tools for academic success
Step: 2

Step: 3
Ace Your Homework with AI
Get the answers you need in no time with our AI-driven, step-by-step assistance
Get Started
Order Flow Trading Secrets To Mastering Market Sentiment Liquidity Volume Patterns Price Action Trading Tools And More
Authors: Daren Price
1st Edition
979-8864803738