

Answered step by step
Verified Expert Solution
Question
1 Approved Answer
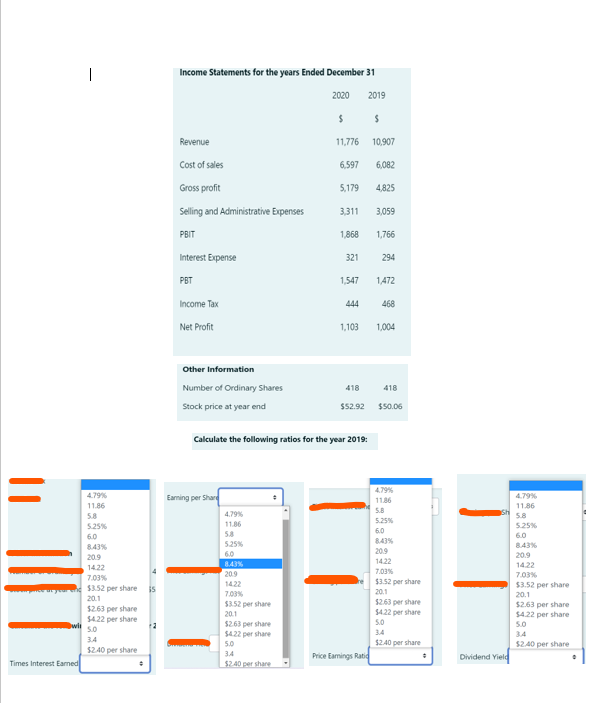
| Income Statements for the years Ended December 31 2020 2019 $ $ 11.776 10.907 6.597 6,082 Revenue Cost of sales Gross profit Selling and
Step by Step Solution
There are 3 Steps involved in it
Step: 1

Get Instant Access to Expert-Tailored Solutions
See step-by-step solutions with expert insights and AI powered tools for academic success
Step: 2

Step: 3
Ace Your Homework with AI
Get the answers you need in no time with our AI-driven, step-by-step assistance
Get Started
Financial Accounting Objective Questions And Explanations
Authors: Irvin N. Gleim
7th Edition
0917539664, 978-0917539664