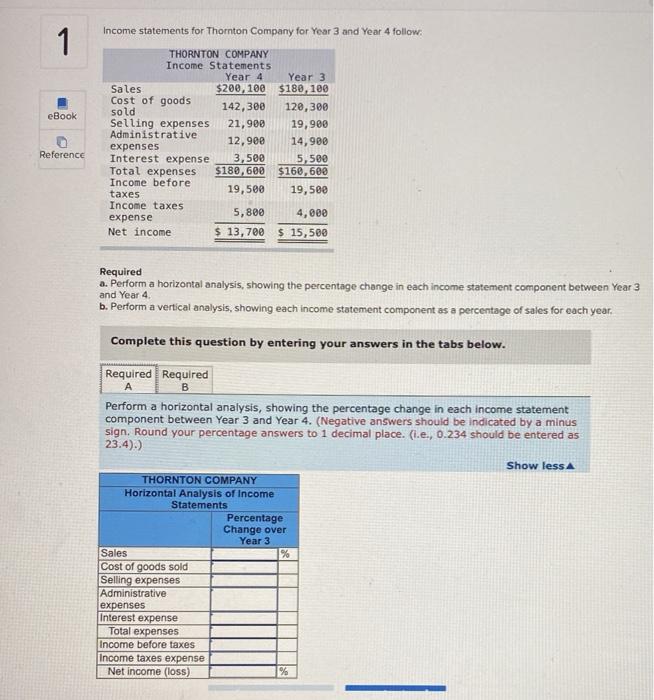
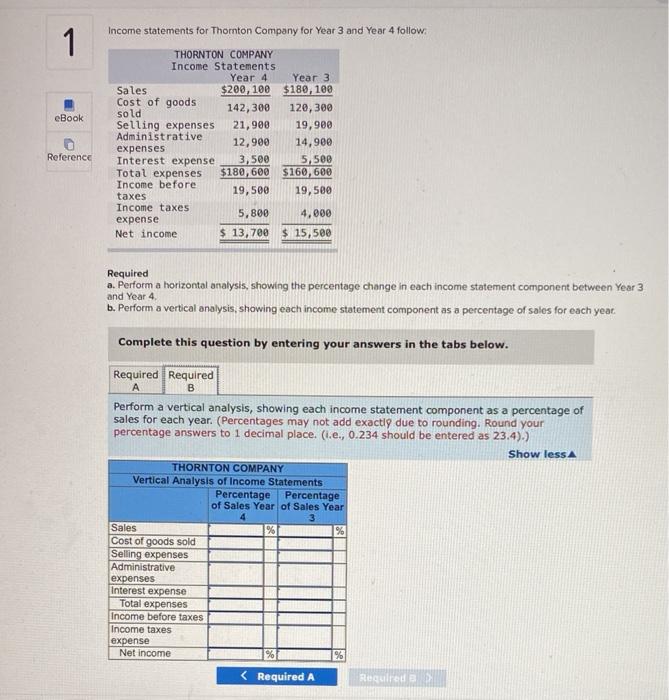
Income statements for Thornton Company for Year 3 and Year 4 follow: 1 1 eBook THORNTON COMPANY Income Statements Year 4 Sales $200, 100 Cost of goods sold 142,300 Selling expenses 21,900 Administrative 12,900 expenses Interest expense 3,500 Total expenses $189,600 Income before 19,500 taxes Income taxes 5,800 expense Net income $ 13,700 Year 3 $180, 100 120,300 19,900 14,900 5,500 $160,600 19,500 Reference 4,000 $ 15,500 Required a. Perform a horizontal analysis showing the percentage change in each income statement component between Year 3 and Year 4. b. Perform a vertical analysis, showing each income statement component as a percentage of sales for each year, Complete this question by entering your answers in the tabs below. Required Required A B Perform a horizontal analysis, showing the percentage change in each income statement component between Year 3 and Year 4. (Negative answers should be indicated by a minus sign. Round your percentage answers to 1 decimal place. (.e., 0.234 should be entered as 23,4).) Show less THORNTON COMPANY Horizontal Analysis of Income Statements Percentage Change over Year 3 Sales % Cost of goods sold Selling expenses Administrative expenses Interest expense Total expenses Income before taxes Income taxes expense Net income (loss) % Income statements for Thornton Company for Year 3 and Year 4 follow. 1 eBook THORNTON COMPANY Income Statements Year 4 Year 3 Sales $200,100 $180, 100 Cost of goods sold 142,300 120, 300 Selling expenses 21,900 19,900 Administrative 12,900 14,900 expenses Interest expense 3,500 5,500 Total expenses $180, 600 $160,600 Income before 19,500 taxes 19,500 Income taxes 5,800 4.000 expense Net income $ 13,700 $ 15,500 Reference Required a. Perform a horizontal analysis, showing the percentage change in each income statement component between Year 3 b. Perform a vertical analysis, showing each income statement component as a percentage of sales for each year. and Year 4 Complete this question by entering your answers in the tabs below. Required Required B Perform a vertical analysis, showing each income statement component as a percentage of sales for each year. (Percentages may not add exactly due to rounding. Round your percentage answers to 1 decimal place. (.e., 0.234 should be entered as 23.4).) Show less THORNTON COMPANY Vertical Analysis of Income Statements Percentage Percentage of Sales Year of Sales Year 3 % Sales Cost of goods sold Selling expenses Administrative expenses Interest expense Total expenses Income before taxes Income taxes expense Net income % Required A Require