Question
INFORMATION FOR NAPOLEON, INC. BUDGET PROJECT Napoleon, Inc. is a company that re-sells one product, a particularly comfortable lawn chair. An overseas contractor makes the
INFORMATION FOR NAPOLEON, INC. BUDGET PROJECT
- Napoleon, Inc. is a company that re-sells one product, a particularly comfortable lawn chair. An overseas contractor makes the product exclusively for Napoleon, so Napoleon has no manufacturing-related costs.
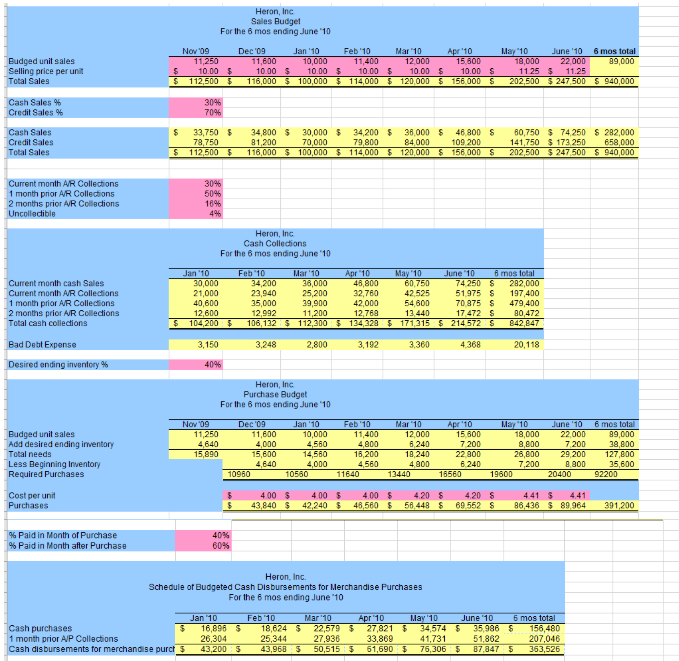
- As of 11/15, each lawn chair costs Napoleon $4 per unit. Napoleon sells each chair for $10 per unit.
- The estimated sales (in units) are as follows:
| Nov 15 | 11,250 |
| Dec 15 | 11,600 |
| Jan 16 | 10,000 |
| Feb 16 | 11,400 |
| Mar 16 | 12,000 |
| Apr 16 | 15,600 |
| May 16 | 18,000 |
| June 16 | 22,000 |
| July 16 | 18,000 |
- Per an existing contract, the cost of each chair is scheduled to increase by 5% on March 1, 2016. In addition, because of increasing costs of plastic webbing, the cost is anticipated to increase by an additional 5% on May 1, 2016. To offset these increases, the company plans to raise the sales price to $11.25 per unit beginning May 1, 2016. The sales forecast (i.e., estimated sales in units) takes this price increase into account.
- Thirty percent of any months sales are for cash, and the remaining 70% are on credit. Thirty percent of the credit sales are collected in the month of sale, 50% are collected in the following month, and 16% are collected in the second month after the sale. The remaining receivables are deemed uncollectible. Bad debts are written off in the month the debt is deemed uncollectible (e.g. if the sale is made in January and is not collected by the end of March, it is written off in March.) No accrual for estimated bad debts is made in the month of sale.
- The firms policy regarding inventory is to stock (i.e. have in ending inventory) 40% of the forecasted demand in units (i.e., estimated sales) for the next month. Napoleon uses the first-in, first-out (FIFO) method in accounting for inventories.
- Forty percent of the inventory purchases are paid for in the month of purchase and the remaining 60% are paid in the following month (i.e. all of the previous months Accounts Payable are paid off by the end of any month.)
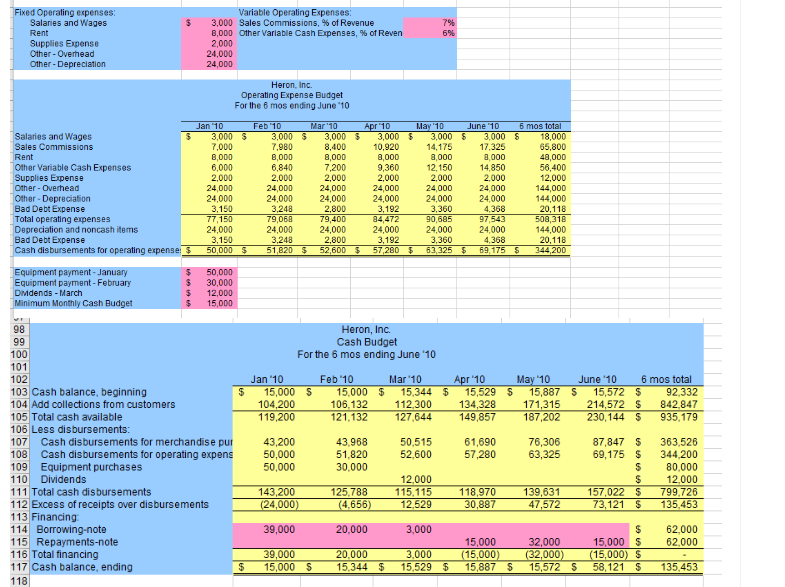
- Per a prior contract, a cash payment of $50,000 for equipment previously purchased is due in January. Another payment of $30,000 is due in February. Depreciation on the equipment previously purchased is included in the overhead cost detailed below (see item 9). Also, dividends of $12,000 are to be paid in March.
- Monthly operating expenses consist of the following (if these are cash expenses, they are paid when incurred):
| Salaries and Wages | $3,000 |
| Sales Commissions | 7% of sales revenue |
| Rent | $8,000 |
| Other Variable Cash Expenses | 6% of sales revenue |
| Supplies Expense: See note | $2,000 |
| Other: See note | $48,000 |
Note: Other general and administrative overhead is expected to be $48,000 per month. Of this amount, $24,000 represents depreciation and other non-cash expenses. The company maintains on hand one months worth of supplies.
- The company must maintain a minimum cash balance of $15,000. Borrowing can make up shortfalls. For simplicity, assume that the bank will only lend (and accept repayments) in $1,000 increments. Ignore interest on the loan in your calculations, but minimize the amount borrowed and pay off any loans as soon as possible.
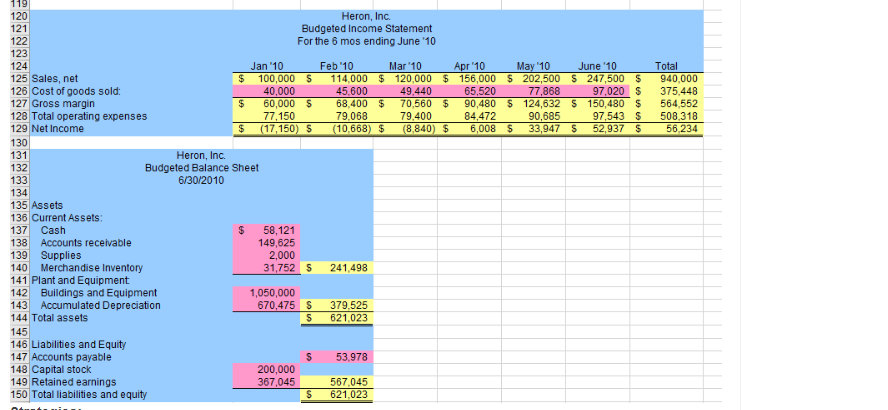
- Cash on hand as of December 31, 2015 is expected to be $15,000. In addition, there will be no notes payable as of this date.
- See below the other Balance Sheet accounts with their expected balances as of December 31, 2015:
- Supplies..................................................... $ 2,000
- Property, Plant and Equipment....................... 1,050,000
- Accumulated Depreciation................................. 526,475
- Common Stock................................................ 200,000
- Retained Earnings............................................. 322,811
Outline the main issues and problems identified during the budgeting process and suggestions for improving the budget forecast. Analyze the issues, including profitability, cash needs, and cost structure. Suggest at least 3 ways you can improve the business forecast for the next 6 months to a year. Test your suggestions by preparing revised budget schedule.
Heron, Inc Sales Budget For the 6 mos ending June 10 6 mos total 89.000 Nov 09 11,250 10.00 112.500 Dec '09 Jan '10 Feb 10 Mar 10 Apr 10 15.600 May 10 18,000 June '10 22.000 12,000 Budged unit sales Selling price per unit Total Sales 11,600 10,000 10.00 $ 100.000 $ 11,400 10.00 10.00 10.00 S 10.00 11.25 S 11.25 202.500 S 247.500 116.000 114,000 120.000 156.000 S 940.000 Cash Sales % Credit Sales % 30% 70% 34,200 $ 79,800 114,000 $120,000 $ 36,000 $ 84,000 Cash Sales 33,750 78,750 112,500 $ 34,800 81,200 116,000 100,000 $ 30,000 $ 70,000 46,800 $ 60,750 74250 282,000 141,750 173,250 202,500 $247,500 940,000 Credit Sales 109 200 156,000 S 658.000 Total Sales Current month A/R Collections 30% 1 month prior A/R Collections 2 months prior AR Collections Uncollectible 50% 16% 4 Heron, Inc Cash Collections For the 6 mos ending June '10 6 mos total 282,000 Jan '10 30,000 Feb 10 Mar 10 38,000 Apr 10 May 10 60,750 June 10 74 250 34,200 Current month cash Sales 46,800 32,760 42,000 12,768 134.320 S Current month AR Collections 21,000 40.600 23.940 25,200 39,900 11,200 42,525 51975 S 197.400 1 month prior AR Collections 2 months prior AR Collections Total cash colledions 35.000 70.875 17.472 $ S171.315 S 214.572 54600 479.400 12,600 104.200 12,992 13.440 80.472 842.847 106.132 $ 112.300 Bad Debt Expense 3,150 3.248 2,800 3,192 3.360 4.368 20,118 Desired ending inventory % 40% Heron, Inc Purchase Budget For the 6 mos ending June 10 Nov 09 Dec '09 Jan '10 Feb 10 Mar 10 Apr 10 May 10 18,000 June '10 6 mos total 11.250 10.000 22.000 Budged unit sales Add desired ending inventory 11,600 11,400 4800 16.200 12,000 15,600 89,000 38.000 127.800 4,640 15,890 4.000 4,560 14.560 6.240 7,200 8.800 7.200 15.600 18.240 22 800 26.800 29.200 Total needs |Less Beginning Inventory Required Purchases 4.640 4.000 4.560 4.800 6.240 7.200 8.800 35,600 92200 10960 11640 13440 16560 19600 10560 20400 420 S Cost per unit Purchases 4.00 $ 43,840 $ 4.00 42,240 $ 4.00 $ 48,560 4.20 58,448 441 4.41 86,436 89,964 69 552 S 391,200 % Paid in Month of Purchase 40 % 60 % 9% Paid in Month after Purchase Heron, Inc. Schedule of Budgeted Cash Disbursements for Merchandise Purchases For the 6 mos ending June '10 6 mos total 156,480 207,046 Jan 10 16,896 $ Feb 10 Mar 10 22,579 $ May 10 34,574 Apr 10 27,821 $ 33,869 61,690 June 10 35,986 $ Cash purchases 1 month prior AP Collections 18,624 $ 26,304 25,344 43.968 27.936 41.731 51.862 43,200 $ 5 Cash disbursements for merchandise purch $ 50.515 $ 75,306 87.847 363.526 Variable Operating Expenses: Fixed Operating expenses Salaries and Wages 3,000 Sales Commissions, % of Revenue 8,000 Other Varia ble Cash Expenses, % of Reven 2,000 24,000 24.000 7% Rent 6% Supplies Expense Other-Overhead Other- Depreciation Heron, Inc. Operating Expense Budget For the 6 mos ending June '10 May 10 3.000 S 14,175 8,000 Jan 10 Mar 10 3.000 8,400 8,000 A"10 3,000 10,920 8,000 June 10 3.000 S 17,325 6 mos total Feb 10 3,000 $ 7,980 8,000 Salaries and Wages Sales Commissions 3.000 $ 18.000 7,000 8,000 6.000 65,800 Rent 8.000 48.000 Other Variable Cash Expenses Supplies Expense 6,840 2,000 24,000 7,200 2,000 24,000 9,360 2,000 12,150 14,850 2,000 56,400 2,000 24,000 2,000 12,000 144,000 144,000 20.118 508,318 144,000 Other-Overhead 24,000 24,000 24,000 24,000 4,368 97.543 24,000 Other - Depreciation Bad Debt Expense 24,000 24,000 3,248 79,068 24,000 24,000 2,800 79,400 24,000 24,000 3,192 84,472 24,000 24,000 3,360 90,685 24,000 3.150 77,150 24,000 3.150 Total operating expenses Depreciation and noncash items Bad Debt Expense Cash disbursements for operating expense $ 3.248 2,800 3.192 3.360 4.368 20.118 57.200 69.175 $ 344.200 50,000 51,820 52,600 $ 63,325 Equipment payment - January Equipment payment - February DMdends -March Minimum Monthly Cash Budget 50,000 30.000 12.000 15,000 Heron, Inc. Cash Budget For the 6 mos ending June 10 98 99 100 101 102 6 mos total 92.332 842,847 935.179 Jan 10 15,000 104,200 119,200 Feb 10 S Mar 10 Apr 10 15.529 S 134,328 149,857 May '10 15,887 S 171,315 187,202 June 10 15,572 $ 214,572 $ 230,144 $ 103 Cash balance, beginning 104 Add collections from customers 15.000 106,132 121,132 15.344 $ 112,300 127,644 105 Total cash available 106 Less disbursements: 363,526 344,200 107 108 Cash disbursements for merchandise pur Cash disbursements for operating expens Equipment purchases Dividends 43,200 50,000 50,000 43,968 50,515 61,690 57.280 76,306 63,325 87,847 S 51,820 52,600 69,175 S 109 110 30.000 80.000 12.000 115,115 12,529 12,000 143,200 (24,000) 139,631 47,572 157,022 S 73,121 $ 111 Total cash disbursements 125.788 118,970 30,887 799,726 135.453 112 Excess of receipts over disbursements 113 Financing 114 Borrowing-note 115 Repayments-note 116 Total financing 117 Cash balance, ending (4,656) S 39,000 20,000 3,000 62,000 32,000 (32,000) 15,572 S 15,000 (15,000) 15.000 (15,000) $ 58.121 S 62,000 39,000 15,000 20,000 15.344 3,000 15,529 $ 15.887 135,453 S 118 119 120 Heron, Inc. Budgeted Income Statement For the 6 mos ending June '10 121 122 123 Total 940.000 124 125 Sales, net 126 Cost of goods sold: 127 Gross margin 128 Total operating expenses Jan '10 Feb 10 Mar '10 Apr '10 May 10 June '10 156,000 202,500 $ 247,500 100,000 S 40,000 60,000 S 77,150 114.000 $ 120,000 $ 49,440 70.560 $ 45.600 65,520 90,480 124,632 S 77,868 97,020 S 150,480 S 97,543 $ 52,937 $ 375,448 564.552 508.318 56,234 68,400 $ 79.068 90,685 33,947 S 79,400 84.472 6,008 (8,840) $ 129 Net Income (17,150) S (10,668) $ 130 131 Heron, Inc. Budgeted Balance Sheet 6/30/2010 132 133 134 135 Assets 136 Current Assets: 137 Cash 58,121 149,625 2,000 138 139 Accounts receivable Supplies Merchandise Inventory 140 31,752 S 241.498 141 Plant and Equipment 142 143 Buildings and Equipment Accumulated Depreciation 1,050,000 670,475 S 379,525 144 Total assets 621,023 145 146 Liabilities and Equity 147 Accounts payable 148 Capital stock 149 Retained earnings 150 Total liabilities and equity S 53,978 200,000 367,045 567.045 621,023 Heron, Inc Sales Budget For the 6 mos ending June 10 6 mos total 89.000 Nov 09 11,250 10.00 112.500 Dec '09 Jan '10 Feb 10 Mar 10 Apr 10 15.600 May 10 18,000 June '10 22.000 12,000 Budged unit sales Selling price per unit Total Sales 11,600 10,000 10.00 $ 100.000 $ 11,400 10.00 10.00 10.00 S 10.00 11.25 S 11.25 202.500 S 247.500 116.000 114,000 120.000 156.000 S 940.000 Cash Sales % Credit Sales % 30% 70% 34,200 $ 79,800 114,000 $120,000 $ 36,000 $ 84,000 Cash Sales 33,750 78,750 112,500 $ 34,800 81,200 116,000 100,000 $ 30,000 $ 70,000 46,800 $ 60,750 74250 282,000 141,750 173,250 202,500 $247,500 940,000 Credit Sales 109 200 156,000 S 658.000 Total Sales Current month A/R Collections 30% 1 month prior A/R Collections 2 months prior AR Collections Uncollectible 50% 16% 4 Heron, Inc Cash Collections For the 6 mos ending June '10 6 mos total 282,000 Jan '10 30,000 Feb 10 Mar 10 38,000 Apr 10 May 10 60,750 June 10 74 250 34,200 Current month cash Sales 46,800 32,760 42,000 12,768 134.320 S Current month AR Collections 21,000 40.600 23.940 25,200 39,900 11,200 42,525 51975 S 197.400 1 month prior AR Collections 2 months prior AR Collections Total cash colledions 35.000 70.875 17.472 $ S171.315 S 214.572 54600 479.400 12,600 104.200 12,992 13.440 80.472 842.847 106.132 $ 112.300 Bad Debt Expense 3,150 3.248 2,800 3,192 3.360 4.368 20,118 Desired ending inventory % 40% Heron, Inc Purchase Budget For the 6 mos ending June 10 Nov 09 Dec '09 Jan '10 Feb 10 Mar 10 Apr 10 May 10 18,000 June '10 6 mos total 11.250 10.000 22.000 Budged unit sales Add desired ending inventory 11,600 11,400 4800 16.200 12,000 15,600 89,000 38.000 127.800 4,640 15,890 4.000 4,560 14.560 6.240 7,200 8.800 7.200 15.600 18.240 22 800 26.800 29.200 Total needs |Less Beginning Inventory Required Purchases 4.640 4.000 4.560 4.800 6.240 7.200 8.800 35,600 92200 10960 11640 13440 16560 19600 10560 20400 420 S Cost per unit Purchases 4.00 $ 43,840 $ 4.00 42,240 $ 4.00 $ 48,560 4.20 58,448 441 4.41 86,436 89,964 69 552 S 391,200 % Paid in Month of Purchase 40 % 60 % 9% Paid in Month after Purchase Heron, Inc. Schedule of Budgeted Cash Disbursements for Merchandise Purchases For the 6 mos ending June '10 6 mos total 156,480 207,046 Jan 10 16,896 $ Feb 10 Mar 10 22,579 $ May 10 34,574 Apr 10 27,821 $ 33,869 61,690 June 10 35,986 $ Cash purchases 1 month prior AP Collections 18,624 $ 26,304 25,344 43.968 27.936 41.731 51.862 43,200 $ 5 Cash disbursements for merchandise purch $ 50.515 $ 75,306 87.847 363.526 Variable Operating Expenses: Fixed Operating expenses Salaries and Wages 3,000 Sales Commissions, % of Revenue 8,000 Other Varia ble Cash Expenses, % of Reven 2,000 24,000 24.000 7% Rent 6% Supplies Expense Other-Overhead Other- Depreciation Heron, Inc. Operating Expense Budget For the 6 mos ending June '10 May 10 3.000 S 14,175 8,000 Jan 10 Mar 10 3.000 8,400 8,000 A"10 3,000 10,920 8,000 June 10 3.000 S 17,325 6 mos total Feb 10 3,000 $ 7,980 8,000 Salaries and Wages Sales Commissions 3.000 $ 18.000 7,000 8,000 6.000 65,800 Rent 8.000 48.000 Other Variable Cash Expenses Supplies Expense 6,840 2,000 24,000 7,200 2,000 24,000 9,360 2,000 12,150 14,850 2,000 56,400 2,000 24,000 2,000 12,000 144,000 144,000 20.118 508,318 144,000 Other-Overhead 24,000 24,000 24,000 24,000 4,368 97.543 24,000 Other - Depreciation Bad Debt Expense 24,000 24,000 3,248 79,068 24,000 24,000 2,800 79,400 24,000 24,000 3,192 84,472 24,000 24,000 3,360 90,685 24,000 3.150 77,150 24,000 3.150 Total operating expenses Depreciation and noncash items Bad Debt Expense Cash disbursements for operating expense $ 3.248 2,800 3.192 3.360 4.368 20.118 57.200 69.175 $ 344.200 50,000 51,820 52,600 $ 63,325 Equipment payment - January Equipment payment - February DMdends -March Minimum Monthly Cash Budget 50,000 30.000 12.000 15,000 Heron, Inc. Cash Budget For the 6 mos ending June 10 98 99 100 101 102 6 mos total 92.332 842,847 935.179 Jan 10 15,000 104,200 119,200 Feb 10 S Mar 10 Apr 10 15.529 S 134,328 149,857 May '10 15,887 S 171,315 187,202 June 10 15,572 $ 214,572 $ 230,144 $ 103 Cash balance, beginning 104 Add collections from customers 15.000 106,132 121,132 15.344 $ 112,300 127,644 105 Total cash available 106 Less disbursements: 363,526 344,200 107 108 Cash disbursements for merchandise pur Cash disbursements for operating expens Equipment purchases Dividends 43,200 50,000 50,000 43,968 50,515 61,690 57.280 76,306 63,325 87,847 S 51,820 52,600 69,175 S 109 110 30.000 80.000 12.000 115,115 12,529 12,000 143,200 (24,000) 139,631 47,572 157,022 S 73,121 $ 111 Total cash disbursements 125.788 118,970 30,887 799,726 135.453 112 Excess of receipts over disbursements 113 Financing 114 Borrowing-note 115 Repayments-note 116 Total financing 117 Cash balance, ending (4,656) S 39,000 20,000 3,000 62,000 32,000 (32,000) 15,572 S 15,000 (15,000) 15.000 (15,000) $ 58.121 S 62,000 39,000 15,000 20,000 15.344 3,000 15,529 $ 15.887 135,453 S 118 119 120 Heron, Inc. Budgeted Income Statement For the 6 mos ending June '10 121 122 123 Total 940.000 124 125 Sales, net 126 Cost of goods sold: 127 Gross margin 128 Total operating expenses Jan '10 Feb 10 Mar '10 Apr '10 May 10 June '10 156,000 202,500 $ 247,500 100,000 S 40,000 60,000 S 77,150 114.000 $ 120,000 $ 49,440 70.560 $ 45.600 65,520 90,480 124,632 S 77,868 97,020 S 150,480 S 97,543 $ 52,937 $ 375,448 564.552 508.318 56,234 68,400 $ 79.068 90,685 33,947 S 79,400 84.472 6,008 (8,840) $ 129 Net Income (17,150) S (10,668) $ 130 131 Heron, Inc. Budgeted Balance Sheet 6/30/2010 132 133 134 135 Assets 136 Current Assets: 137 Cash 58,121 149,625 2,000 138 139 Accounts receivable Supplies Merchandise Inventory 140 31,752 S 241.498 141 Plant and Equipment 142 143 Buildings and Equipment Accumulated Depreciation 1,050,000 670,475 S 379,525 144 Total assets 621,023 145 146 Liabilities and Equity 147 Accounts payable 148 Capital stock 149 Retained earnings 150 Total liabilities and equity S 53,978 200,000 367,045 567.045 621,023Step by Step Solution
There are 3 Steps involved in it
Step: 1

Get Instant Access to Expert-Tailored Solutions
See step-by-step solutions with expert insights and AI powered tools for academic success
Step: 2

Step: 3
Ace Your Homework with AI
Get the answers you need in no time with our AI-driven, step-by-step assistance
Get Started