Answered step by step
Verified Expert Solution
Question
1 Approved Answer
instruction:read the summary, look at all the figures and carefully answer the question. NB: Incorrect response will lead to a thumbs down. Experimental Summary: Northern
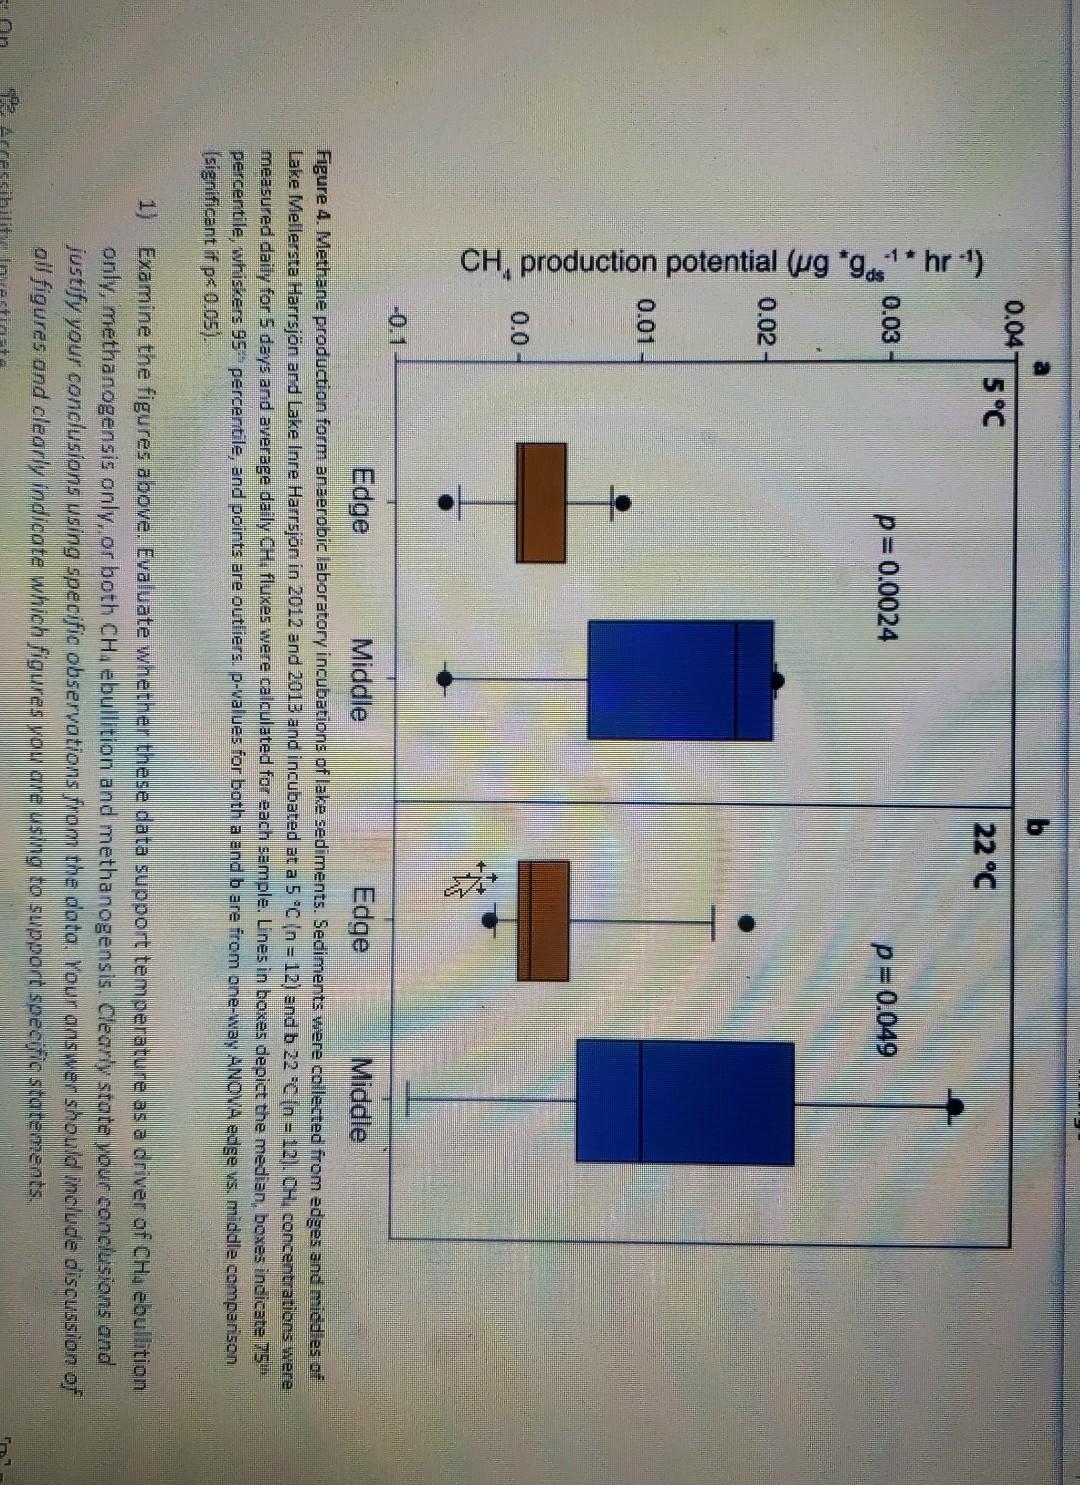
instruction:read the summary, look at all the figures and carefully answer the question. NB: Incorrect response will lead to a thumbs down.
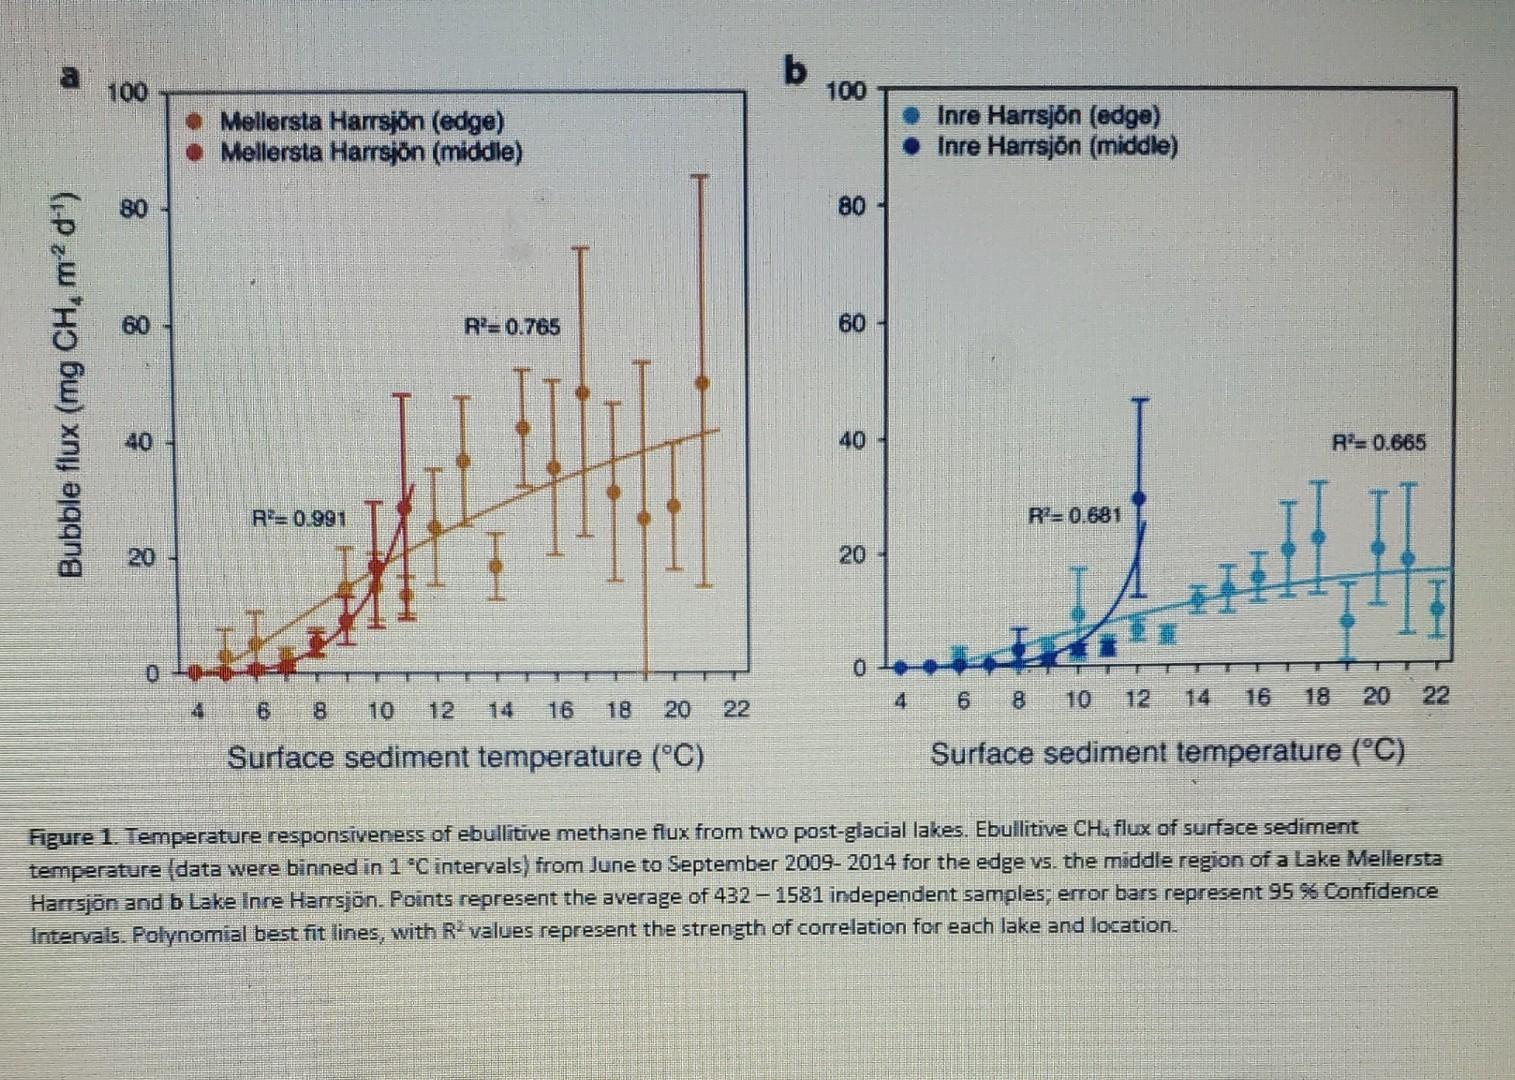
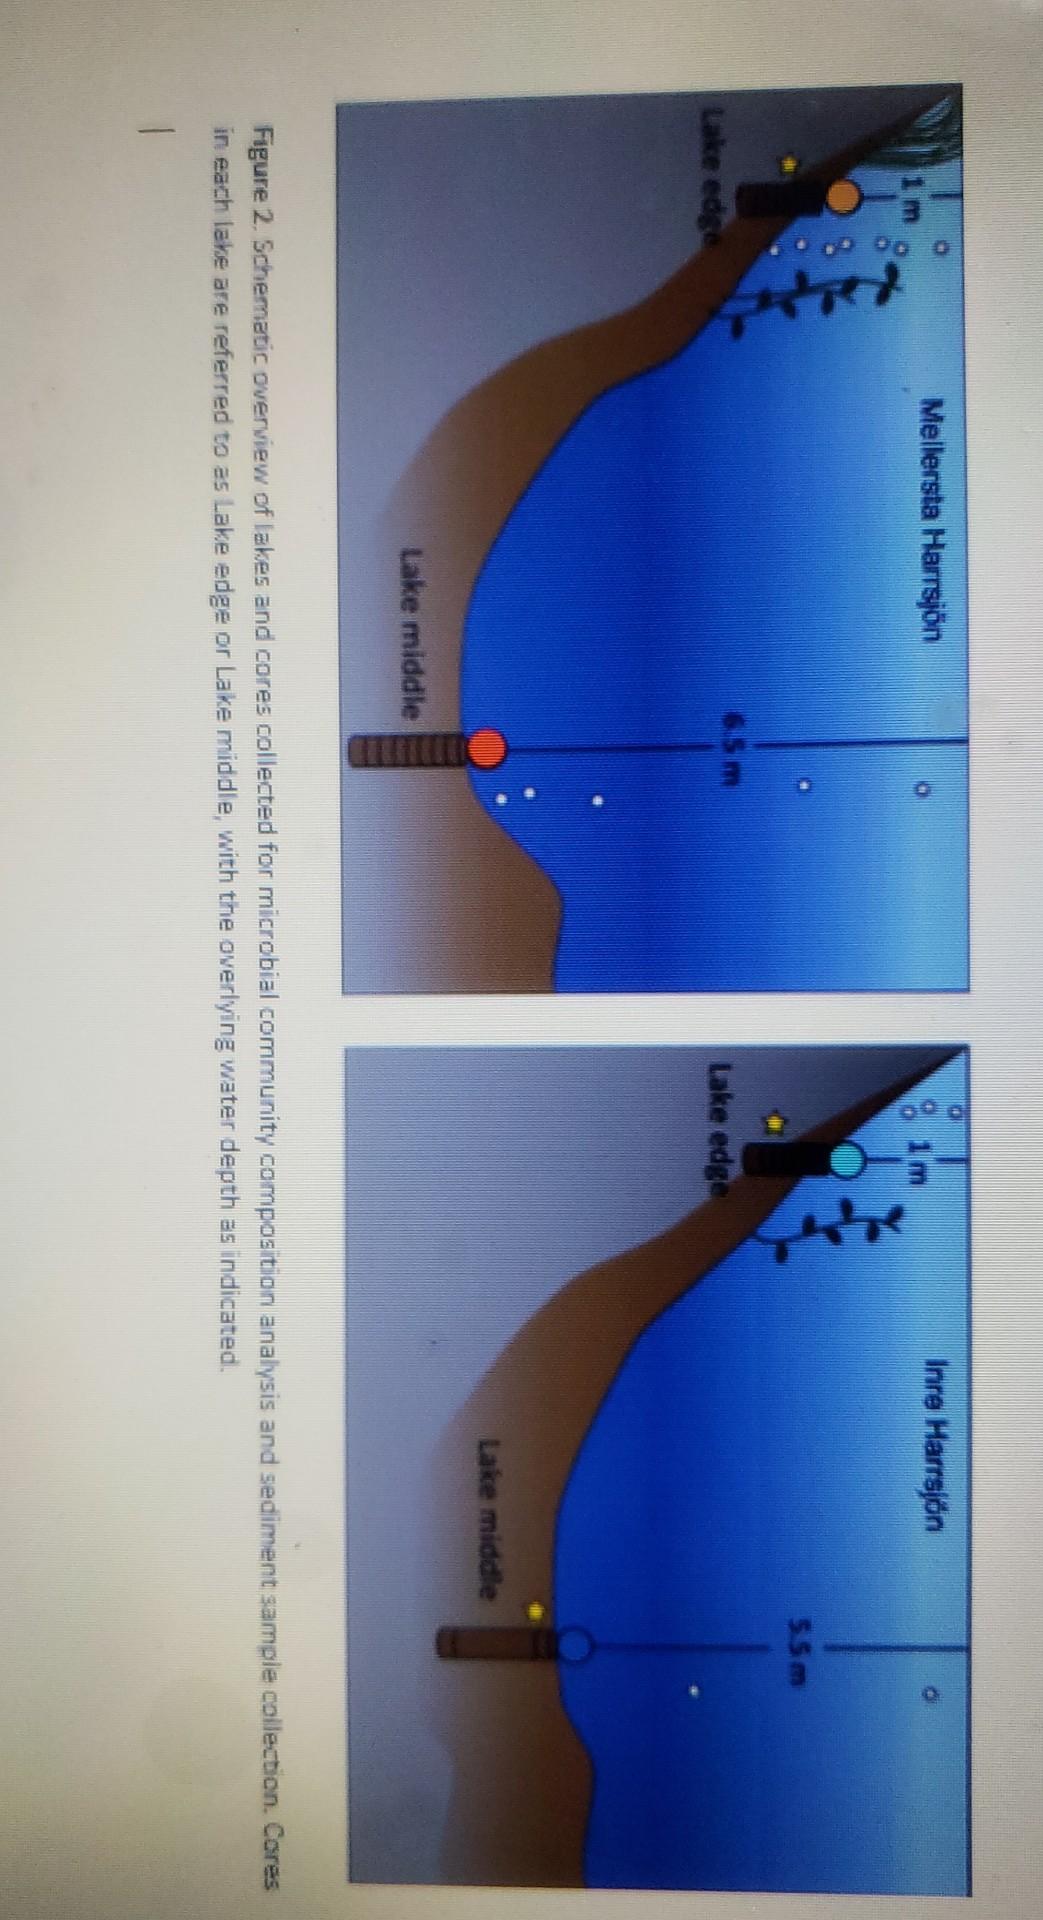
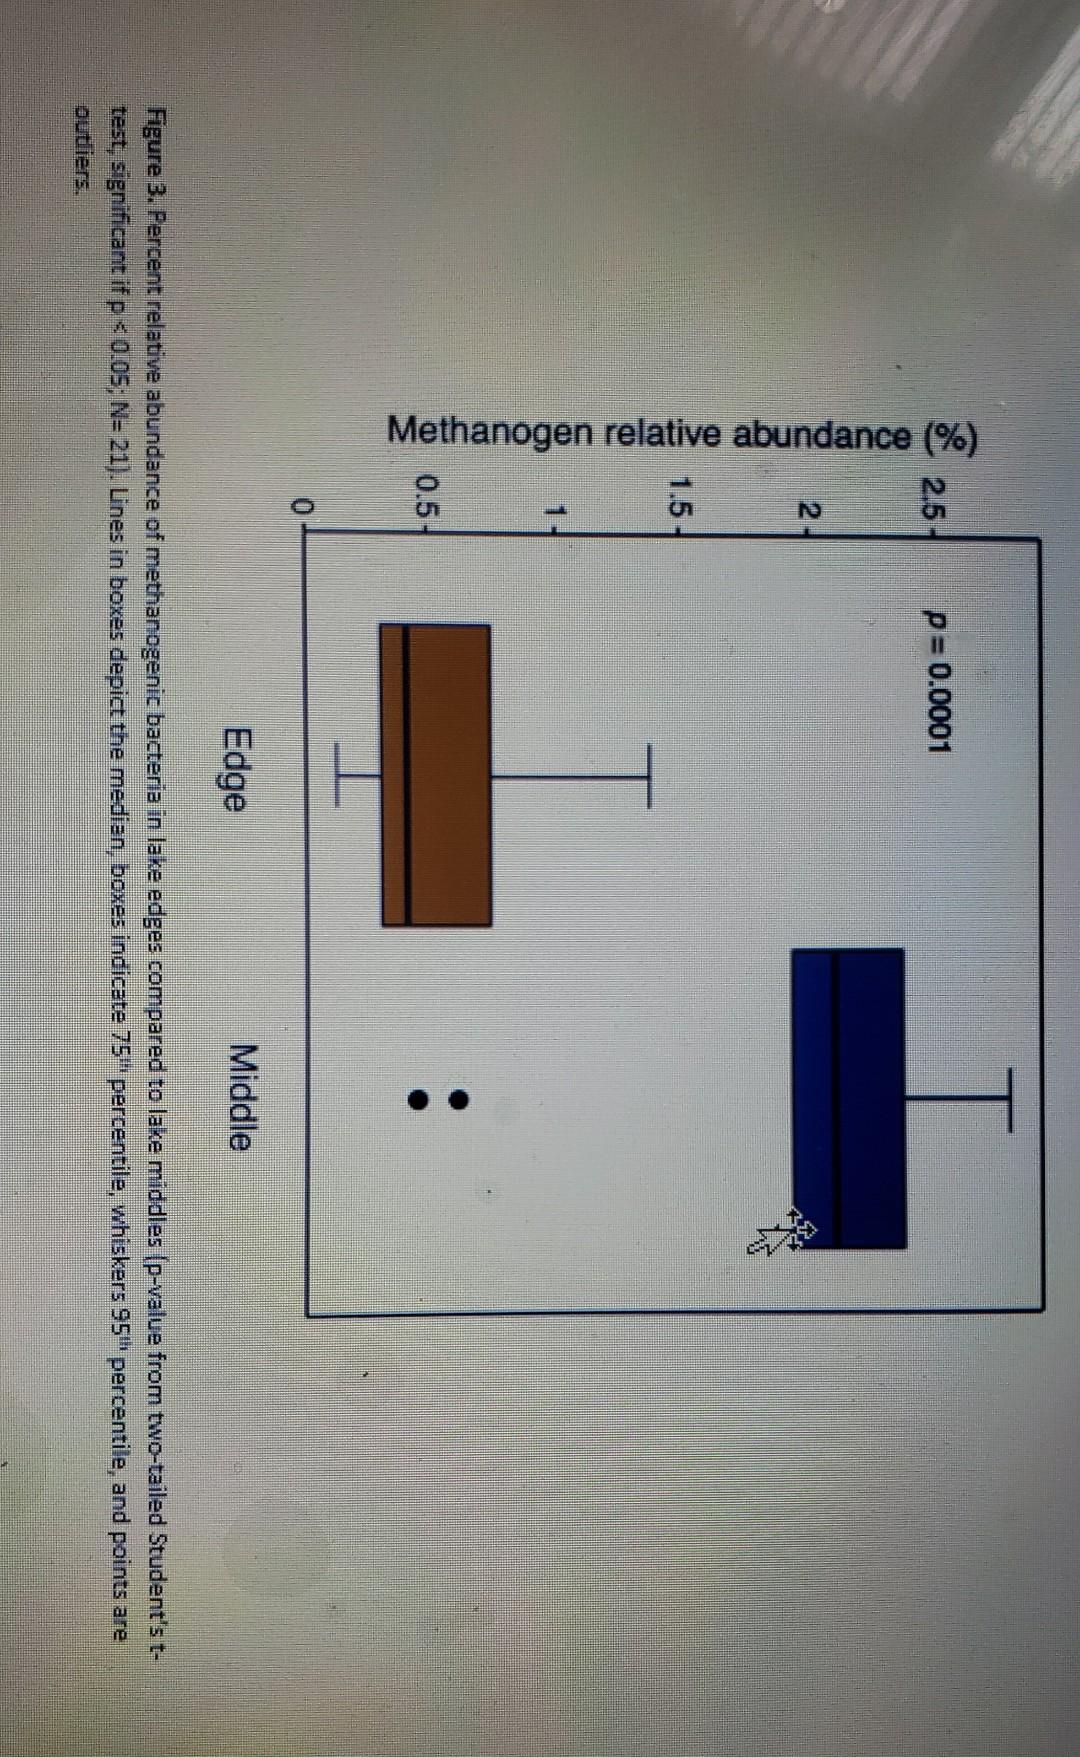
Experimental Summary: Northern post-glacial lakes are a large and understudied source of atmospheric methane (CH4), an important greenhouse gas with more than 80 times the warming power of CO2. Ebullition (the formation of gas bubbles) quickly exports CH4 from lake sediments, where it is produced by methanogenic bacteria, to the surface before it can be oxidized by microbes in the water column. Increasing temperatures are expected to decrease CH4 solubility in freshwater, resulting in increasing CH4 flux into the atmosphere. Increasing temperatures may also affect the distribution and productivity of methanogenic bacteria. Understanding the role that temperature plays in CH4 export critical to modeling glob climate change scenarios. To better understand the effects of temperature on CHa flux from freshwater systems and the distribution of methanogenic bacteria, Emerson et al. (2021) sampled sediments in two Swedish lakes, Mellersta Harrsjn and Inre Harrsjn. In the field, the authors characterized CHa flux as a function of temperature, sampled the microbial community composition, and collected a sediment sample for further analysis. In the laboratory, the authors assessed CHa production of microbes collected at the edge and middle of each lake under different temperatures (5 C and 22 C). This experiment allowed the authors to evaluate temperature as an abiotic regulator of methanogenic bacterial productivity. The results of all experiments are provided in the figures below: b a b 100 100 Mellersta Harrsjn (edge) Mellersta Harsjn (middle) Inre Harrsjn (edge) Inre Harrsjn (middle) 80 80 60 R?=0.765 60 Bubble flux (mg CH, m d') 40 40 R 0.665 R = 0.991 R? 0.681 20 20 171 an 0 ET 4 12 16 18 20 4 22 10 12 6 8 16 18 20 22 Surface sediment temperature (C) Surface sediment temperature (C) Figure 1. Temperature responsiveness of ebullitive methane flux from two post-glacial lakes. Ebullitive CH, flux of surface sediment temperature (data were binned in 1 C intervals) from June to September 2009- 2014 for the edge vs. the middle region of a Lake Mellersta Harrsjn and b Lake Inre Harrsjn. Points represent the average of 432 1581 independent samples; error bars represent 95 % Confidence Intervals. Polynomial best fit lines, with R values represent the strength of correlation for each lake and location. Mellersta Harrsjn Inre Harrsjn im 5.5m Lake edge Lake edge Lake middle Lake middle Figure 2. Schematic overview of lakes and cores collected for microbial community composition analysis and sediment sample collection. Cores in each lake are referred to as Lake edge or Lake middle, with the overlying water depth as indicated. T 2.5 p=0.0001 Methanogen relative abundance (%) 1.5 : 0.5 Edge Middle Figure 3. Percent relative abundance of methanogenic bacteria in lake edges compared to lake middles (p-value from two-tailed Student's t- test, significant ifpStep by Step Solution
There are 3 Steps involved in it
Step: 1

Get Instant Access to Expert-Tailored Solutions
See step-by-step solutions with expert insights and AI powered tools for academic success
Step: 2

Step: 3

Ace Your Homework with AI
Get the answers you need in no time with our AI-driven, step-by-step assistance
Get Started


