Instructions:
 Assumptions:
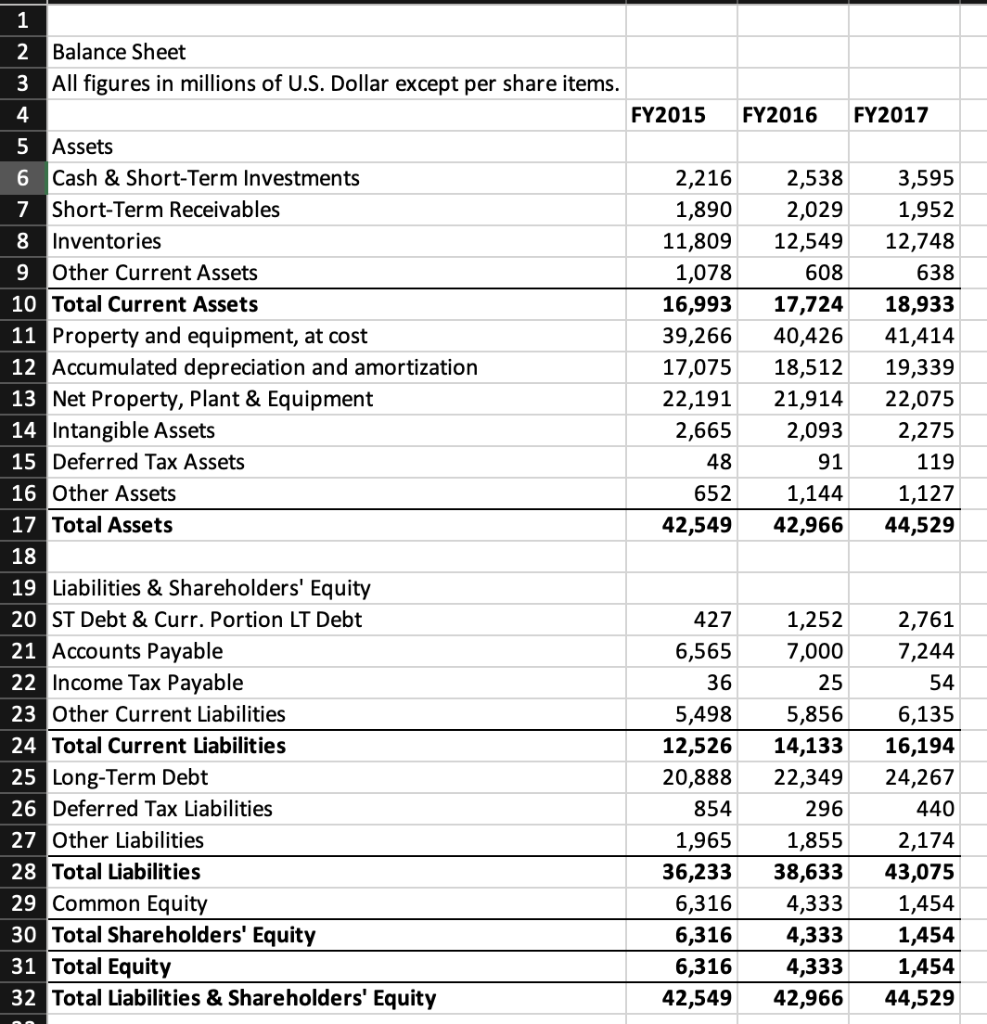
 Balance sheet:
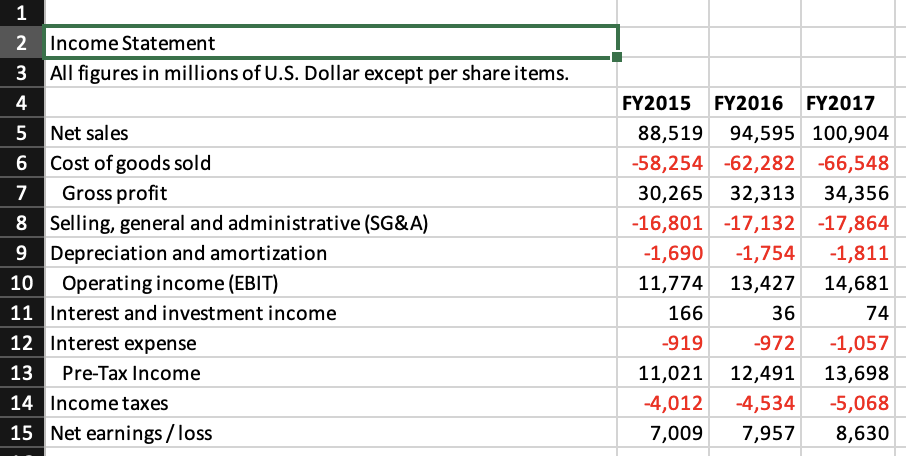
Income Statement:
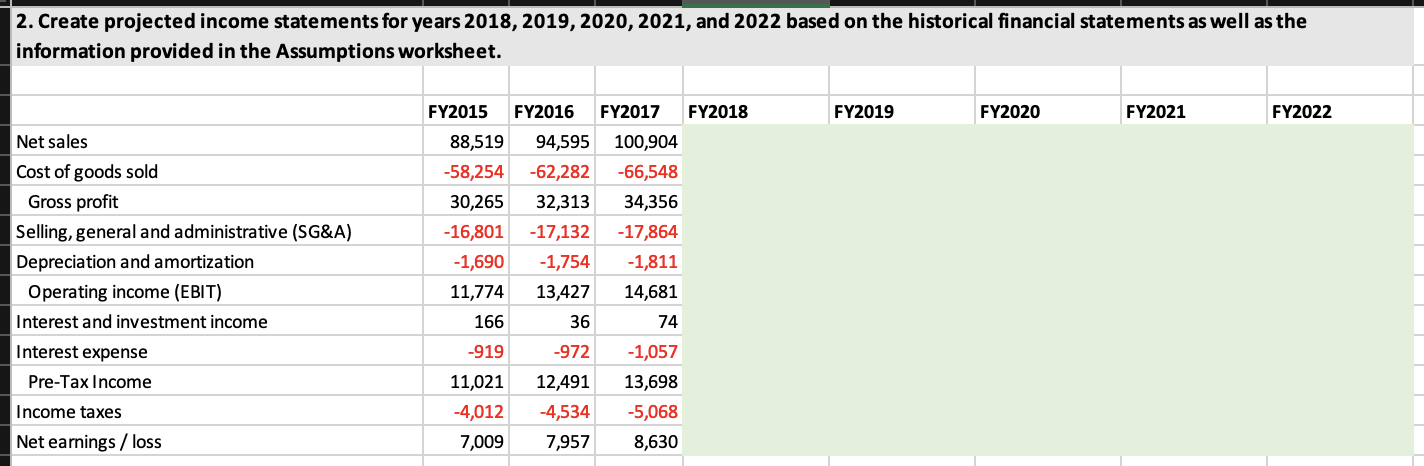
NEED ANSWER FOR QUESTION 2 (information provided above, there is no other info):
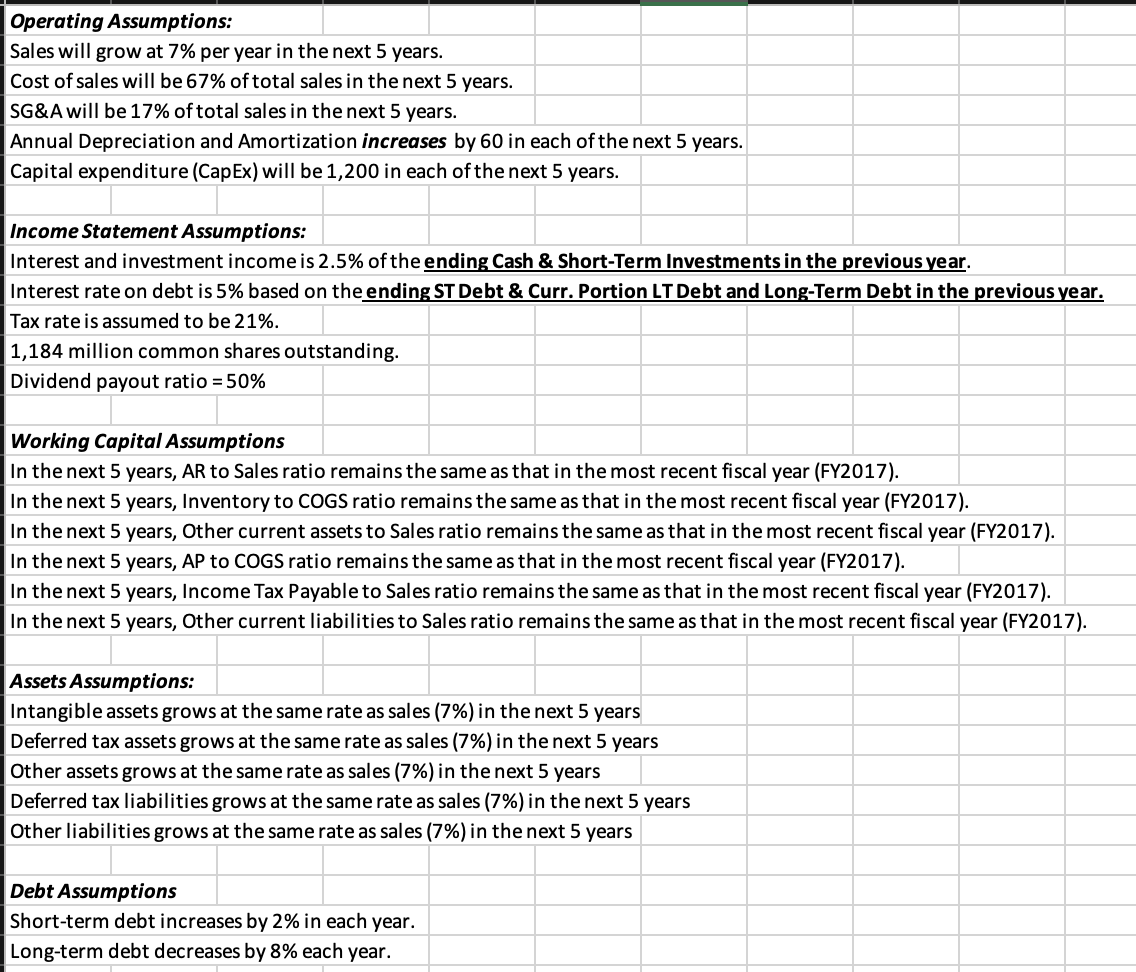
Unless you are using information from the Assumptions tab, calculated numbers should always be linked to original source cells. DEASE NOTE THAT YOU WILL NOT EARN POINTS IF YOUR ANSWER IS HARDCODED. Operating Assumptions: Sales will grow at 7% per year in the next 5 years. Cost of sales will be 67% of total sales in the next 5 years. SG\&A will be 17% of total sales in the next 5 years. Annual Depreciation and Amortization increases by 60 in each of the next 5 years. Capital expenditure (CapEx) will be 1,200 in each of the next 5 years. Income Statement Assumptions: Interest and investment income is 2.5% of the ending Cash & Short-Term Investments in the previous year. Interest rate on debt is 5% based on the ending ST Debt & Curr. Portion LT Debt and Long-Term Debt in the previous year. Tax rate is assumed to be 21%. 1,184 million common shares outstanding. Dividend payout ratio =50% Working Capital Assumptions In the next 5 years, AR to Sales ratio remains the same as that in the most recent fiscal year (FY2017). In the next 5 years, Inventory to COGS ratio remains the same as that in the most recent fiscal year (FY2017). In the next 5 years, Other current assets to Sales ratio remains the same as that in the most recent fiscal year (FY2017). In the next 5 years, AP to COGS ratio remains the same as that in the most recent fiscal year (FY2017). In the next 5 years, Income Tax Payable to Sales ratio remains the same as that in the most recent fiscal year (FY2017). In the next 5 years, Other current liabilities to Sales ratio remains the same as that in the most recent fiscal year (FY2017). Assets Assumptions: Intangible assets grows at the same rate as sales (7%) in the next 5 years Deferred tax assets grows at the same rate as sales (7%) in the next 5 years Other assets grows at the same rate as sales (7%) in the next 5 years Deferred tax liabilities grows at the same rate as sales (7%) in the next 5 years Other liabilities grows at the same rate as sales (7%) in the next 5 years Debt Assumptions Short-term debt increases by 2% in each year. Long-term debt decreases by 8% each year. \begin{tabular}{l} \hline 1 \\ 2 \end{tabular} 3 All figures in millions of U.S. Dollar except per share items. \begin{tabular}{|c|l|r|r|r|} \hline 4 & & & \\ \hline 5 & FY2015 & FY2016 & FY2017 \\ \hline 6 & Cssets & & & \\ \hline 7 & Short-Term Receivables & 2,216 & 2,538 & 3,595 \\ \hline 8 & Inventories & 1,890 & 2,029 & 1,952 \\ \hline 9 & Other Current Assets & 11,809 & 12,549 & 12,748 \\ \hline 10 & Total Current Assets & 1,078 & 608 & 638 \\ \hline 11 & Property and equipment, at cost & 16,993 & 17,724 & 18,933 \\ \hline 12 & Accumulated depreciation and amortization & 39,266 & 40,426 & 41,414 \\ \hline 13 & Net Property, Plant \& Equipment & 17,075 & 18,512 & 19,339 \\ \hline 14 & Intangible Assets & 22,191 & 21,914 & 22,075 \\ \hline 15 & Deferred Tax Assets & 2,665 & 2,093 & 2,275 \\ \hline 16 & Other Assets & 48 & 91 & 119 \\ \hline 17 & Total Assets & 652 & 1,144 & 1,127 \\ \hline 18 & & 42,549 & 42,966 & 44,529 \\ \hline \end{tabular} 19 Liabilities \& Shareholders' Equity \begin{tabular}{|l|l|r|r|r|} \hline 20 & ST Debt \& Curr. Portion LT Debt & 427 & 1,252 & 2,761 \\ \hline 21 & Accounts Payable & 6,565 & 7,000 & 7,244 \\ \hline 22 & Income Tax Payable & 36 & 25 & 54 \\ \hline 23 & Other Current Liabilities & 5,498 & 5,856 & 6,135 \\ \hline 24 & Total Current Liabilities & 12,526 & 14,133 & 16,194 \\ \hline 25 & Long-Term Debt & 20,888 & 22,349 & 24,267 \\ \hline 26 & Deferred Tax Liabilities & 854 & 296 & 440 \\ \hline 27 & Other Liabilities & 1,965 & 1,855 & 2,174 \\ \hline 28 & Total Liabilities & 36,233 & 38,633 & 43,075 \\ \hline 29 & Common Equity & 6,316 & 4,333 & 1,454 \\ \hline 30 & Total Shareholders' Equity & 6,316 & 4,333 & 1,454 \\ \hline 31 & Total Equity & 6,316 & 4,333 & 1,454 \\ \hline 32 & Total Liabilities \& Shareholders' Equity & 42,549 & 42,966 & 44,529 \\ \hline \end{tabular} 2. Create projected income statements for years 2018,2019,2020,2021, and 2022 based on the historical financial statements as well as the information provided in the Assumptions worksheet. Unless you are using information from the Assumptions tab, calculated numbers should always be linked to original source cells. DEASE NOTE THAT YOU WILL NOT EARN POINTS IF YOUR ANSWER IS HARDCODED. Operating Assumptions: Sales will grow at 7% per year in the next 5 years. Cost of sales will be 67% of total sales in the next 5 years. SG\&A will be 17% of total sales in the next 5 years. Annual Depreciation and Amortization increases by 60 in each of the next 5 years. Capital expenditure (CapEx) will be 1,200 in each of the next 5 years. Income Statement Assumptions: Interest and investment income is 2.5% of the ending Cash & Short-Term Investments in the previous year. Interest rate on debt is 5% based on the ending ST Debt & Curr. Portion LT Debt and Long-Term Debt in the previous year. Tax rate is assumed to be 21%. 1,184 million common shares outstanding. Dividend payout ratio =50% Working Capital Assumptions In the next 5 years, AR to Sales ratio remains the same as that in the most recent fiscal year (FY2017). In the next 5 years, Inventory to COGS ratio remains the same as that in the most recent fiscal year (FY2017). In the next 5 years, Other current assets to Sales ratio remains the same as that in the most recent fiscal year (FY2017). In the next 5 years, AP to COGS ratio remains the same as that in the most recent fiscal year (FY2017). In the next 5 years, Income Tax Payable to Sales ratio remains the same as that in the most recent fiscal year (FY2017). In the next 5 years, Other current liabilities to Sales ratio remains the same as that in the most recent fiscal year (FY2017). Assets Assumptions: Intangible assets grows at the same rate as sales (7%) in the next 5 years Deferred tax assets grows at the same rate as sales (7%) in the next 5 years Other assets grows at the same rate as sales (7%) in the next 5 years Deferred tax liabilities grows at the same rate as sales (7%) in the next 5 years Other liabilities grows at the same rate as sales (7%) in the next 5 years Debt Assumptions Short-term debt increases by 2% in each year. Long-term debt decreases by 8% each year. \begin{tabular}{l} \hline 1 \\ 2 \end{tabular} 3 All figures in millions of U.S. Dollar except per share items. \begin{tabular}{|c|l|r|r|r|} \hline 4 & & & \\ \hline 5 & FY2015 & FY2016 & FY2017 \\ \hline 6 & Cssets & & & \\ \hline 7 & Short-Term Receivables & 2,216 & 2,538 & 3,595 \\ \hline 8 & Inventories & 1,890 & 2,029 & 1,952 \\ \hline 9 & Other Current Assets & 11,809 & 12,549 & 12,748 \\ \hline 10 & Total Current Assets & 1,078 & 608 & 638 \\ \hline 11 & Property and equipment, at cost & 16,993 & 17,724 & 18,933 \\ \hline 12 & Accumulated depreciation and amortization & 39,266 & 40,426 & 41,414 \\ \hline 13 & Net Property, Plant \& Equipment & 17,075 & 18,512 & 19,339 \\ \hline 14 & Intangible Assets & 22,191 & 21,914 & 22,075 \\ \hline 15 & Deferred Tax Assets & 2,665 & 2,093 & 2,275 \\ \hline 16 & Other Assets & 48 & 91 & 119 \\ \hline 17 & Total Assets & 652 & 1,144 & 1,127 \\ \hline 18 & & 42,549 & 42,966 & 44,529 \\ \hline \end{tabular} 19 Liabilities \& Shareholders' Equity \begin{tabular}{|l|l|r|r|r|} \hline 20 & ST Debt \& Curr. Portion LT Debt & 427 & 1,252 & 2,761 \\ \hline 21 & Accounts Payable & 6,565 & 7,000 & 7,244 \\ \hline 22 & Income Tax Payable & 36 & 25 & 54 \\ \hline 23 & Other Current Liabilities & 5,498 & 5,856 & 6,135 \\ \hline 24 & Total Current Liabilities & 12,526 & 14,133 & 16,194 \\ \hline 25 & Long-Term Debt & 20,888 & 22,349 & 24,267 \\ \hline 26 & Deferred Tax Liabilities & 854 & 296 & 440 \\ \hline 27 & Other Liabilities & 1,965 & 1,855 & 2,174 \\ \hline 28 & Total Liabilities & 36,233 & 38,633 & 43,075 \\ \hline 29 & Common Equity & 6,316 & 4,333 & 1,454 \\ \hline 30 & Total Shareholders' Equity & 6,316 & 4,333 & 1,454 \\ \hline 31 & Total Equity & 6,316 & 4,333 & 1,454 \\ \hline 32 & Total Liabilities \& Shareholders' Equity & 42,549 & 42,966 & 44,529 \\ \hline \end{tabular} 2. Create projected income statements for years 2018,2019,2020,2021, and 2022 based on the historical financial statements as well as the information provided in the Assumptions worksheet