Answered step by step
Verified Expert Solution
Question
1 Approved Answer
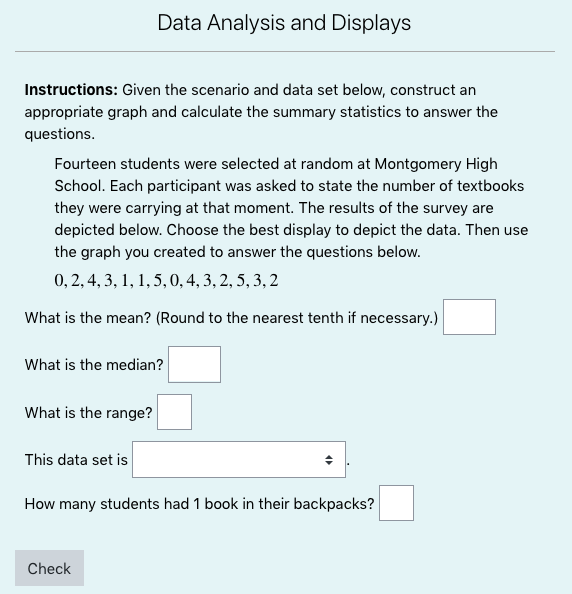
Instructions:Given the scenario and data set below, construct an appropriate graph and calculate the summary statistics to answer the questions. Fourteen students were selected at
Instructions:Given the scenario and data set below, construct an appropriate graph and calculate the summary statistics to answer the questions.
Fourteen students were selected at random at Montgomery High School. Each participant was asked to state the number of textbooks they were carrying at that moment. The results of the survey are depicted below. Choose the best display to depict the data. Then use the graph you created to answer the questions below.

Step by Step Solution
There are 3 Steps involved in it
Step: 1

Get Instant Access to Expert-Tailored Solutions
See step-by-step solutions with expert insights and AI powered tools for academic success
Step: 2

Step: 3

Ace Your Homework with AI
Get the answers you need in no time with our AI-driven, step-by-step assistance
Get Started


