Investment cost (today) Project life Annual labor costs savings Annual waste disposal cost savings Annual Byproduct sales Required rate of return Tax rate Basic
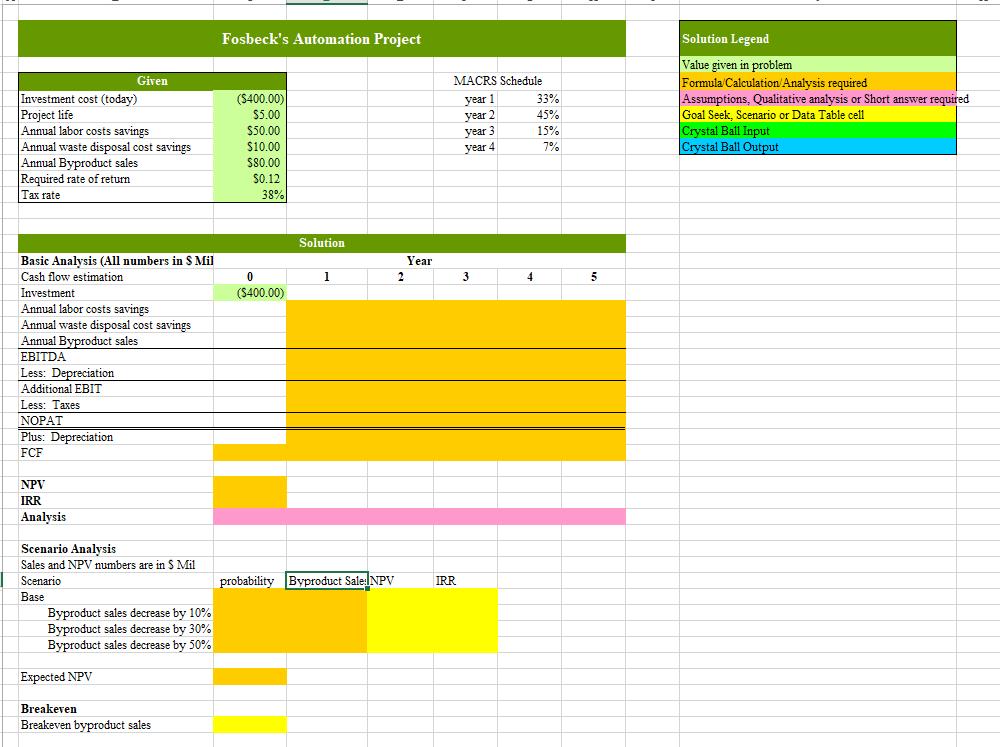
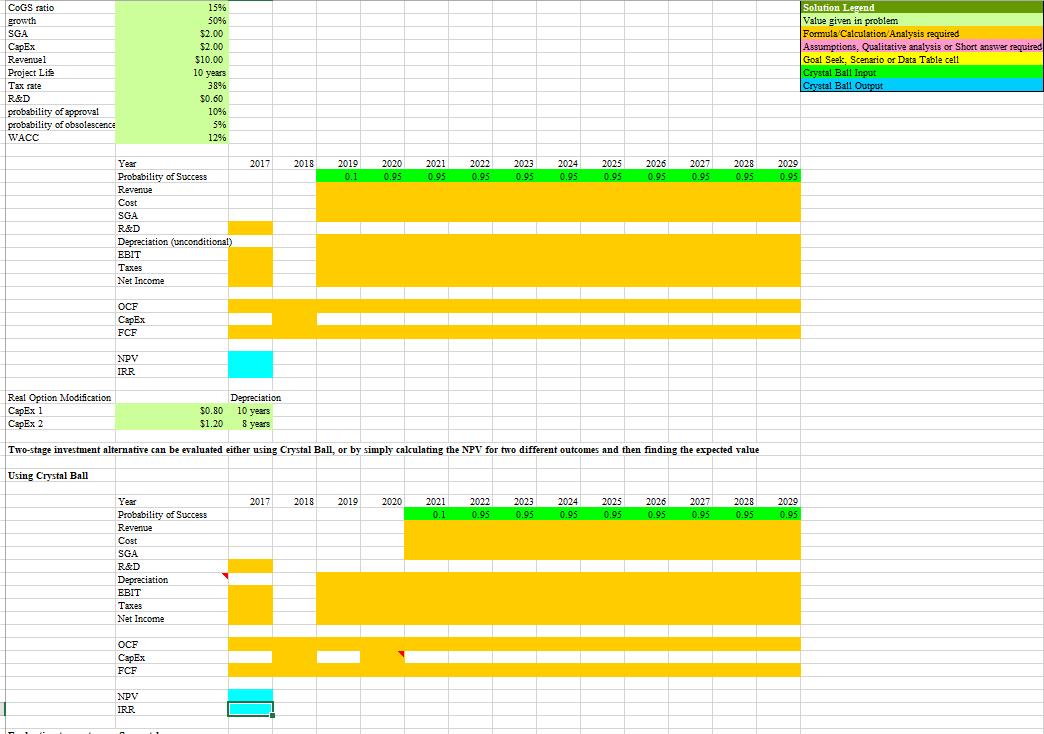
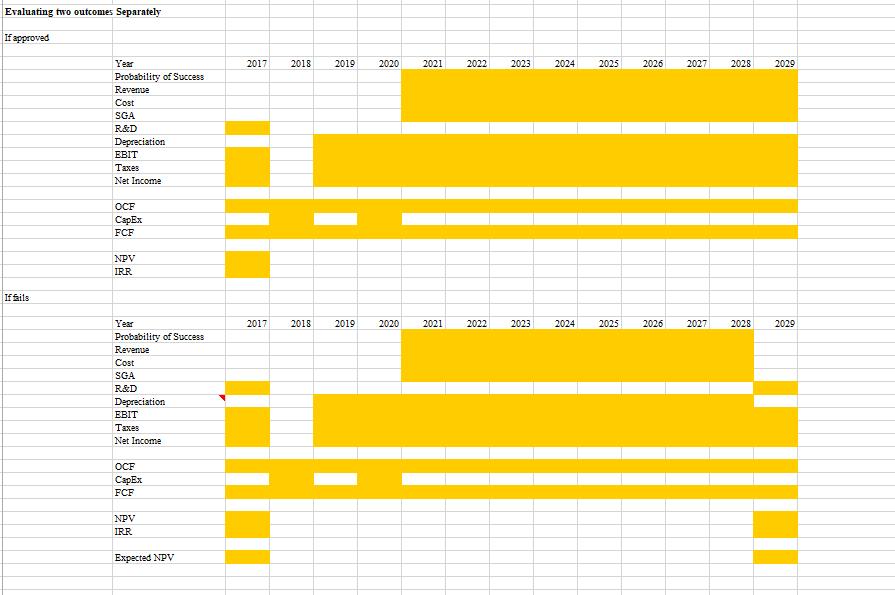
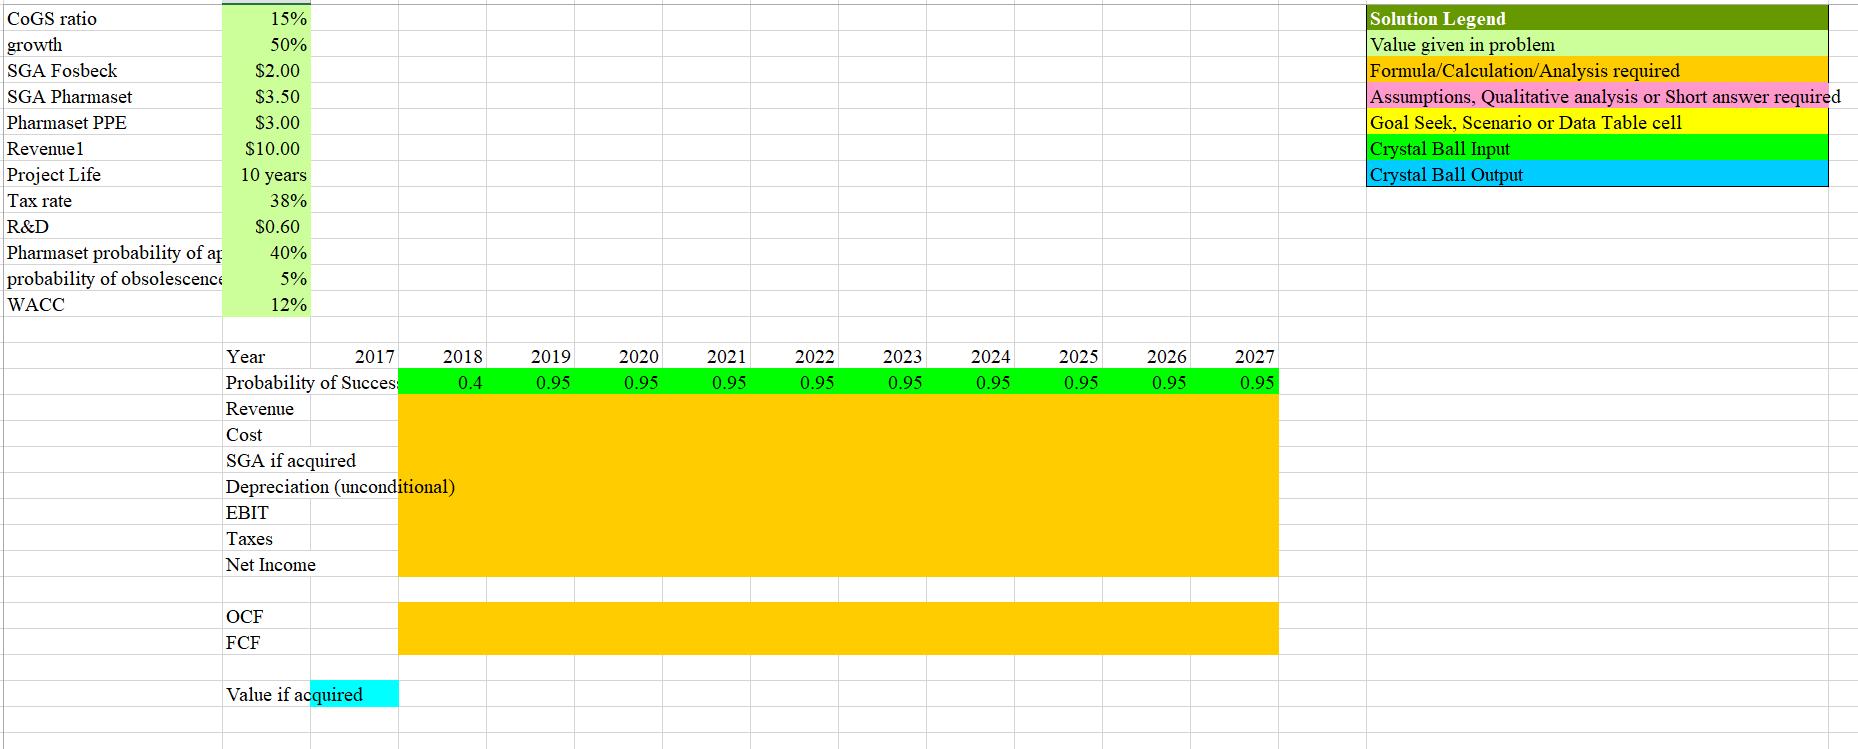
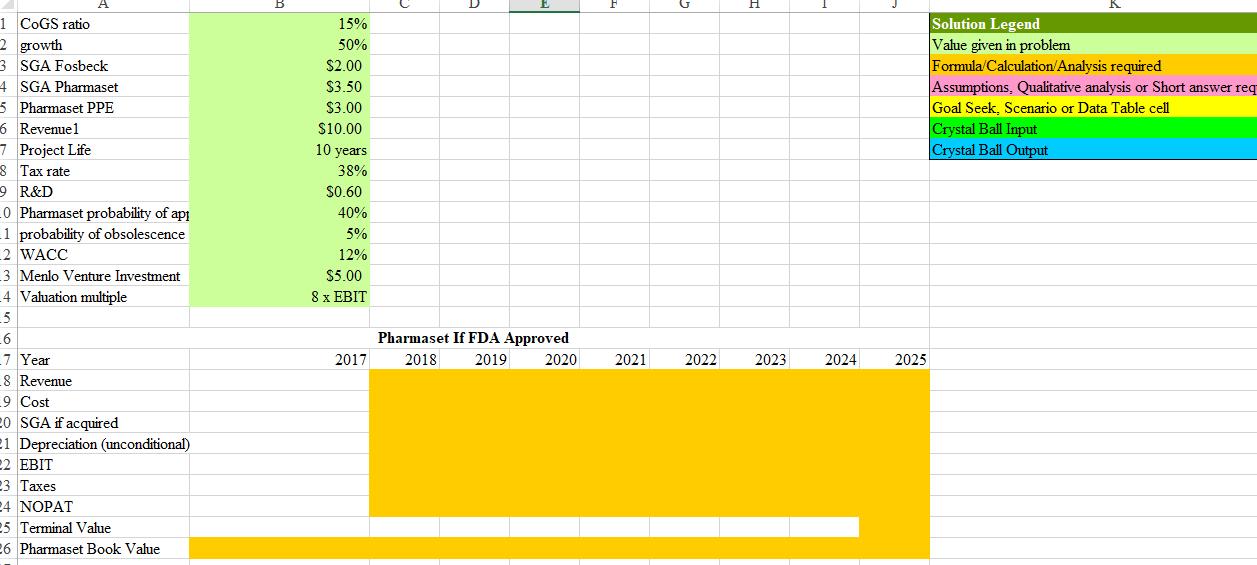
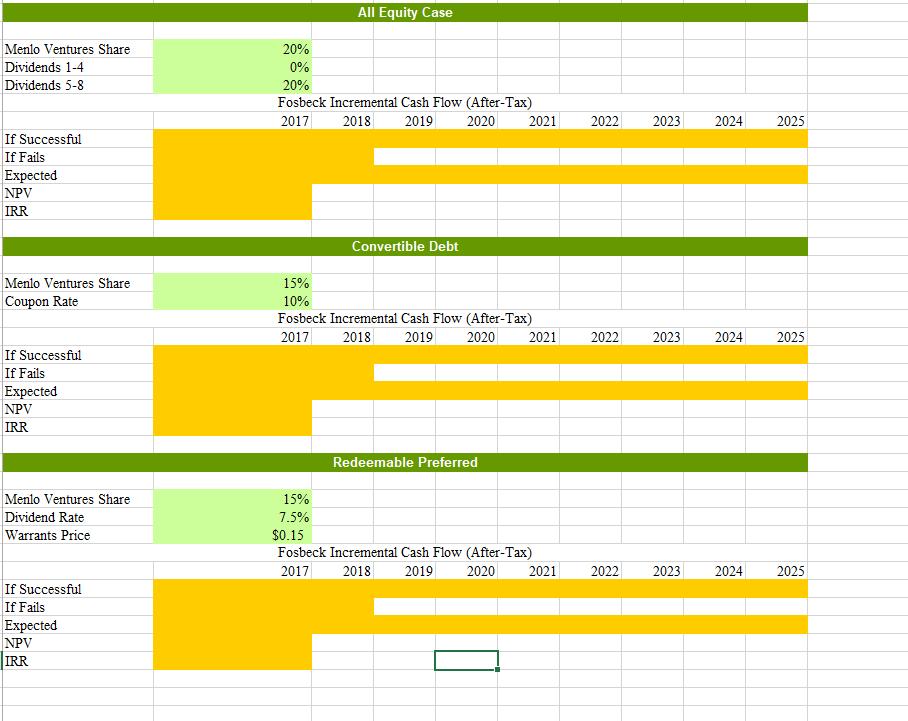

Investment cost (today) Project life Annual labor costs savings Annual waste disposal cost savings Annual Byproduct sales Required rate of return Tax rate Basic Analysis (All numbers in S Mil Cash flow estimation Given Investment Annual labor costs savings Annual waste disposal cost savings Eatio Annual Byproduct sales EBITDA Less: Depreciation Additional EBIT Less: Taxes NOPAT Plus: Depreciation FCF NPV IRR Analysis Scenario Analysis Sales and NPV numbers are in S Mil Scenario Base Byproduct sales decrease by 10% Byproduct sales decrease by 30% Byproduct sales decrease by 50% Expected NPV Breakeven Breakeven byproduct sales Fosbeck's Automation Project ($400.00) $5.00 $50.00 $10.00 $80.00 $0.12 38% 0 ($400.00) Solution 1 probability Byproduct Sale! NPV 2 Year MACRS Schedule year 1 year 2 year 3 year 4 IRR 3 4 33% 45% 15% 7% 5 Solution Legend Value given in problem Formula Calculation/Analysis required Assumptions, Qualitative analysis or Short answer required Goal Seek, Scenario or Data Table cell Crystal Ball Input Crystal Ball Output COGS ratio growth SGA CapEx Revenuel Project Life Tax rate R&D probability of approval probability of obsolescence WACC Real Option Modification CapEx 1 CapEx 2 Jhabud Cost Year Probability of Success Revenue SGA R&D EBIT Depreciation (unconditional) Taxes Net Income OCF CapEx FCF NPV IRR 15% 50% $2.00 $2.00 $10.00 10 years 38% $0.60 10% 5% 12% Cost SGA R&D Depreciation EBIT Taxes Net Income OCF CapEx FCF Year Probability of Success Revenue NPV IRR 2017 Depreciation $0.80 10 years $1.20 8 years 2018 2019 0.1 2017 2018 2020 0.95 Two-stage investment alternative can be evaluated either using Crystal Ball, or by simply calculating the NPV for two different outcomes and then finding the expected value Using Crystal Ball 2019 2021 2022 2023 0.95 0.95 0.95 T 2020 2021 2022 0.1 0.95 2024 0.95 2023 0.95 2024 0.95 2025 0.95 T 2028 2026 2027 0.95 0.95 0.95 2025 0.95 2026 2027 2028 0.95 0.95 0.95 2029 0.95 2029 0.95 Solution Legend Value given in problem. Formula Calculation Analysis required Assumptions, Qualitative analysis or Short answer required Goal Seek, Scenario or Data Table cell Crystal Ball Input Crystal Ball Output Evaluating two outcomes Separately If approved If fails Year Probability of Success Revenue Cost SGA R&D Depreciation EBIT Taxes Net Income OCF CapEx FCF NPV IRR Year Probability of Success Revenue Cost SGA R&D Depreciation EBIT Taxes Net Income OCF CapEx FCF NPV IRR Expected NPV 2017 2018 2017 2018 2019 2019 2020 2020 2021 2022 2021 2022 2023 2023 2024 2024 2025 2025 2026 2026 2027 2027 2028 2029 2028 2029 COGS ratio growth SGA Fosbeck SGA Pharmaset Pharmaset PPE Revenue 1 Project Life Tax rate R&D Pharmaset probability of ap probability of obsolescence WACC 15% 50% $2.00 $3.50 $3.00 $10.00 10 years 38% $0.60 40% 5% 12% Year 2017 Probability of Succes Revenue Cost SGA if acquired Depreciation (unconditional) EBIT Taxes Net Income OCF FCF 2018 0.4 Value if acquired 2019 0.95 2020 0.95 2021 0.95 2022 0.95 2023 0.95 2024 0.95 2025 0.95 2026 0.95 2027 0.95 Solution Legend Value given in problem Formula/Calculation/Analysis required Assumptions, Qualitative analysis or Short answer required Goal Seek, Scenario or Data Table cell Crystal Ball Input Crystal Ball Output A 1 COGS ratio 2 growth 3 SGA Fosbeck 4 SGA Pharmaset 5 Pharmaset PPE 6 Revenuel 7 Project Life 8 Tax rate 9 R&D 0 Pharmaset probability of app 1 probability of obsolescence 2 WACC 3 Menlo Venture Investment 4 Valuation multiple 5 _6 7 Year 8 Revenue 9 Cost 20 SGA if acquired 21 Depreciation (unconditional) 22 EBIT 23 Taxes 24 NOPAT 25 Terminal Value 26 Pharmaset Book Value 15% 50% $2.00 $3.50 $3.00 $10.00 10 years 38% $0.60 40% 5% 12% $5.00 8 x EBIT 2017 Pharmaset If FDA Approved 2018 2019 2020 F 2021 2022 H 2023 2024 2025 Solution Legend Value given in problem Formula/Calculation/Analysis required Assumptions, Qualitative analysis or Short answer req Goal Seek, Scenario or Data Table cell Crystal Ball Input Crystal Ball Output Menlo Ventures Share Dividends 1-4 Dividends 5-8 If Successful If Fails Expected NPV IRR Menlo Ventures Share Coupon Rate If Successful If Fails Expected NPV IRR Menlo Ventures Share Dividend Rate Warrants Price If Successful If Fails Expected NPV IRR 20% 0% 20% Fosbeck Incremental Cash Flow (After-Tax) 2017 2018 All Equity Case 15% 7.5% $0.15 2019 2020 2021 2022 2023 15% 10% Fosbeck Incremental Cash Flow (After-Tax) 2017 2018 2020 2019 Convertible Debt Redeemable Preferred 2021 Fosbeck Incremental Cash Flow (After-Tax) 2017 2018 2019 2020 2021 2022 2022 2024 2023 2023 2024 2025 2025 2024 2025 year 1 year 2 year 3 year 4 33% 3000000 44% 3000000 15% 3000000 7% 3000000 0.4 0.4 0.4 0.4 399,960 533,400 177,720 88,920 998,684 33% 3000000 44% 3000000 15% 3000000 7% 3000000 999,900 1,333,500 444,300 222,300
Step by Step Solution
3.32 Rating (158 Votes )
There are 3 Steps involved in it
Step: 1
Ans We need to calculate NPV and IRR to make the decision This can be calculated using the spreadshe...
See step-by-step solutions with expert insights and AI powered tools for academic success
Step: 2

Step: 3

Ace Your Homework with AI
Get the answers you need in no time with our AI-driven, step-by-step assistance
Get Started


