

Answered step by step
Verified Expert Solution
Question
1 Approved Answer
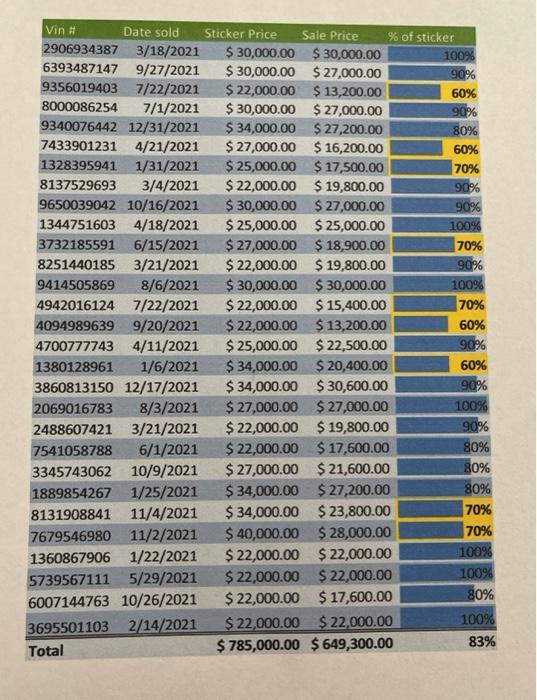
it includes a long list of vin#, make. model, year, mileage and stucker price. if you could just give me the formula and steps to
it includes a long list of vin#, make. model, year, mileage and stucker price. if you could just give me the formula and steps to do this, i can insert the numbers. thank you!
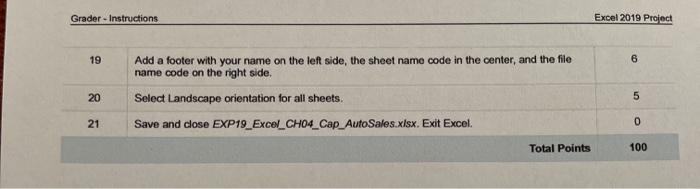
this is the example of what a final result should look like
can you just include the steps you would use for each step if you had the information, like just include the equation to find the necessary solutions 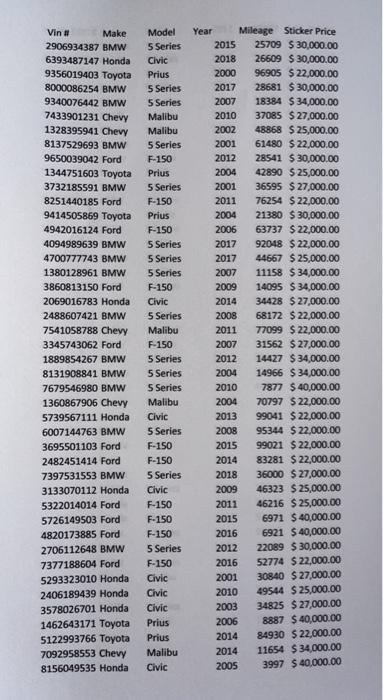
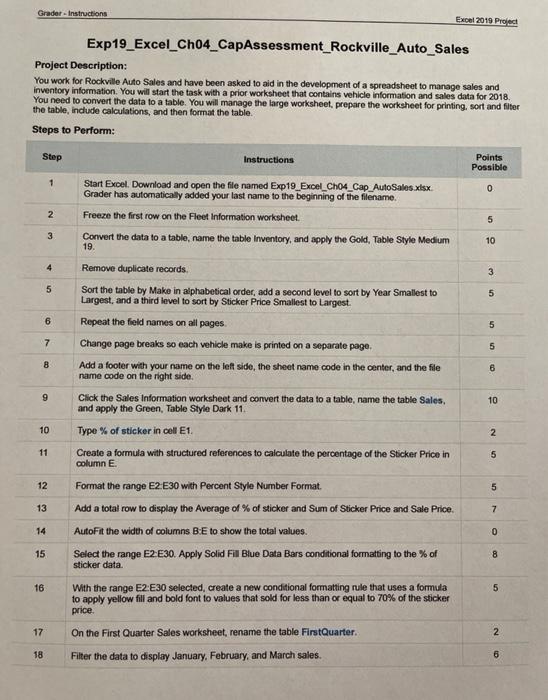
Grader-Instructions Excel 2019 Project Exp19_Excel_Ch04_CapAssessment_Rockville_Auto_Sales Project Description: You work for Rockville Auto Sales and have been asked to aid in the development of a spreadsheet to manage sales and inventory information. You will start the task with a prior worksheet that contains vehicle information and sales data for 2018 You need to convert the data to a table. You will manage the large worksheet, prepare the worksheet for printing, sort and filter the table, include calculations, and then format the table Steps to Perform: Step Instructions Points Possible 1 0 2 Start Excel. Download and open the file named Exp19 Excel_Ch04 Cap Auto Sales.xlsx Grader has automatically added your last name to the beginning of the filename. Freeze the first row on the Fleet Information worksheet. Convert the data to a table, name the table Inventory, and apply the Gold, Table Style Medium 19. 5 3 10 4 Remove duplicate records 3 5 5 6 5 7 5 8 6 Sort the table by Make in alphabetical order, add a second level to sort by Year Smallest to Largest, and a third level to sort by Sticker Price Smallest to Largest Repeat the field names on all pages Change page breaks so each vehicle make is printed on a separate page. Add a footer with your name on the left side, the sheet name code in the center, and the file name code on the right side. Click the Sales Information worksheet and convert the data to a table, name the table Sales and apply the Green, Table Style Dark 11. Type % of sticker in cell E1 Create a formula with structured references to calculate the percentage of the Sticker Price in column E. 9 10 10 2 11 5 12 Format the range E2 E30 with Percent Style Number Format 5 13 Add a total row to display the Average of % of sticker and Sum of Sticker Price and Sale Price 7 14 AutoFit the width of columns B.E to show the total values. 0 15 Select the range E2 E30. Apply Solid Fil Blue Data Bars conditional formatting to the % of 8 sticker data 16 5 With the range E2:E30 selected, create a new conditional formatting rule that uses a formula to apply yellow fill and bold font to values that sold for less than or equal to 70% of the sticker price On the First Quarter Sales worksheet, rename the table FirstQuarter 17 2 18 Filter the data to display January, February, and March sales. 6 Grader - Instructions Excel 2019 Project 19 6 20 5 Add a footer with your name on the left side, the sheet name code in the center, and the file name code on the right side, Select Landscape orientation for all sheets Save and close EXP19_Excel_CH04_Cap Auto Sales.xlsx. Exit Excel Total Points 21 0 100 90% Vin H Date sold Sticker Price Sale Price % of sticker 2906934387 3/18/2021 $ 30,000.00 $30,000.00 100% 6393487147 9/27/2021 $ 30,000.00 $ 27,000.00 90% 9356019403 7/22/2021 $ 22,000.00 $ 13,200.00 60% 8000086254 7/1/2021 $ 30,000.00 $ 27,000.00 9340076442 12/31/2021 $ 34,000.00 $ 27,200.00 80% 7433901231 4/21/2021 $ 27,000.00 $ 16,200.00 60% 1328395941 1/31/2021 $ 25,000.00 $ 17,500.00 70% 8137529693 3/4/2021 $ 22,000.00 $ 19,800.00 90% 9650039042 10/16/2021 $ 30,000.00 $ 27,000.00 90% 1344751603 4/18/2021 $ 25,000.00 $ 25,000.00 100% 3732185591 6/15/2021 $ 27,000.00 $ 18,900.00 70% 8251440185 3/21/2021 $ 22,000.00 $ 19,800.00 90% 9414505869 8/6/2021 $ 30,000.00 $30,000.00 100% 4942016124 7/22/2021 $ 22,000.00 $ 15,400.00 70% 4094989639 9/20/2021 $ 22,000.00 $ 13,200.00 60% 4700777743 4/11/2021 $ 25,000.00 $ 22,500.00 90% 1380128961 1/6/2021 $ 34,000.00 $ 20,400.00 60% 3860813150 12/17/2021 $ 34,000.00 $ 30,600.00 90% 2069016783 8/3/2021 $ 27,000.00 $ 27,000.00 100% 2488607421 3/21/2021 $ 22,000.00 $ 19,800.00 90% 7541058788 6/1/2021 $ 22,000.00 $ 17,600.00 80% 3345743062 10/9/2021 $ 27,000.00 $ 21,600.00 80% 1889854267 1/25/2021 $ 34,000.00 $ 27,200.00 80% 8131908841 11/4/2021 $ 34,000.00 $ 23,800.00 70% 7679546980 11/2/2021 $ 40,000.00 $ 28,000.00 70% 100% 1360867906 1/22/2021 $ 22,000.00 $ 22,000.00 5739567111 5/29/2021 100% $ 22,000.00 $ 22,000.00 80% 6007144763 10/26/2021 $ 22,000.00 $ 17,600.00 3695501103 100% 2/14/2021 $ 22,000.00 $ 22,000.00 $ 785,000.00 $ 649,300.00 83% Total 2000 2009 Vin # Make 2906934387 BMW 6393487147 Honda 9356019403 Toyota 8000086254 BMW 9340076442 BMW 7433901231 Chevy 1328395941 Chevy 8137529693 BMW 9650039042 Ford 1344751603 Toyota 3732185591 BMW 8251440185 Ford 9414505869 Toyota 4942016124 Ford 4094989639 BMW 4700777743 BMW 1380128961 BMW 3860813150 Ford 2069016783 Honda 2488607421 BMW 7541058788 Chevy 3345743062 Ford 1889854267 BMW 8131908841 BMW 7679546980 BMW 1360867906 Chevy 5739567111 Honda 6007144763 BMW 3695501103 Ford 2482451414 Ford 7397531553 BMW 3133070112 Honda 5322014014 Ford 5726149503 Ford 4820173885 Ford 2706112648 BMW 7377188604 Ford 5293323010 Honda 2406189439 Honda 3578026701 Honda 1462643171 Toyota 5122993766 Toyota 7092958553 Chevy 8156049535 Honda Model 5 Series Civic Prius 5 Series 5 Series Malibu Malibu 5 Series F-150 Prius 5 Series F-150 Prius F-150 5 Series 5 Series 5 Series F-150 Civic 5 Series Malibu F-150 5 Series 5 Series 5 Series Malibu Civic 5 Series F-150 F-150 5 Series Civic F-150 F-150 F-150 5 Series F-150 Civic Civic Civic Prius Prius Malibu Civic Year Mileage Sticker Price 2015 25709 $ 30,000.00 2018 26609 $ 30,000.00 96905 $ 22,000.00 2017 28681 $30,000.00 2007 18384 $ 34,000.00 2010 37085 $ 27,000.00 2002 48868 $ 25,000.00 2001 61480 $ 22,000.00 2012 28541 $ 30,000.00 2004 42890 $ 25,000.00 2001 36595 $ 27,000.00 2011 76254 $ 22,000.00 2004 21380 $ 30,000.00 2006 63737 $ 22,000.00 2017 92048 $ 22,000.00 2017 44667 $ 25,000.00 2007 11158 $ 34,000.00 14095 $ 34,000.00 2014 34428 $ 27,000.00 2008 68172 $ 22,000.00 2011 77099 $ 22,000.00 2007 31562 $ 27,000.00 2012 14427 $ 34,000.00 2004 14966 $ 34,000.00 2010 7877 $ 40,000.00 2004 70797 $ 22,000.00 2013 99041 $ 22,000.00 2008 95344 $ 22,000.00 2015 99021 $ 22,000.00 2014 83281 $ 22,000.00 2018 36000 $ 27,000.00 2009 46323 $ 25,000.00 2011 46216 $ 25,000.00 2015 6971 $ 40,000.00 2016 6921 $ 40,000.00 2012 22089 $ 30,000.00 2016 52774 $ 22,000.00 2001 30840 $ 27,000.00 2010 49544 $25,000.00 2003 34825 $ 27,000.00 2006 8887 $ 40,000.00 2014 84930 $ 22,000.00 2014 11654 $ 34,000.00 2005 3997 $ 40,000.00 Grader-Instructions Excel 2019 Project Exp19_Excel_Ch04_CapAssessment_Rockville_Auto_Sales Project Description: You work for Rockville Auto Sales and have been asked to aid in the development of a spreadsheet to manage sales and inventory information. You will start the task with a prior worksheet that contains vehicle information and sales data for 2018 You need to convert the data to a table. You will manage the large worksheet, prepare the worksheet for printing, sort and filter the table, include calculations, and then format the table Steps to Perform: Step Instructions Points Possible 1 0 2 Start Excel. Download and open the file named Exp19 Excel_Ch04 Cap Auto Sales.xlsx Grader has automatically added your last name to the beginning of the filename. Freeze the first row on the Fleet Information worksheet. Convert the data to a table, name the table Inventory, and apply the Gold, Table Style Medium 19. 5 3 10 4 Remove duplicate records 3 5 5 6 5 7 5 8 6 Sort the table by Make in alphabetical order, add a second level to sort by Year Smallest to Largest, and a third level to sort by Sticker Price Smallest to Largest Repeat the field names on all pages Change page breaks so each vehicle make is printed on a separate page. Add a footer with your name on the left side, the sheet name code in the center, and the file name code on the right side. Click the Sales Information worksheet and convert the data to a table, name the table Sales and apply the Green, Table Style Dark 11. Type % of sticker in cell E1 Create a formula with structured references to calculate the percentage of the Sticker Price in column E. 9 10 10 2 11 5 12 Format the range E2 E30 with Percent Style Number Format 5 13 Add a total row to display the Average of % of sticker and Sum of Sticker Price and Sale Price 7 14 AutoFit the width of columns B.E to show the total values. 0 15 Select the range E2 E30. Apply Solid Fil Blue Data Bars conditional formatting to the % of 8 sticker data 16 5 With the range E2:E30 selected, create a new conditional formatting rule that uses a formula to apply yellow fill and bold font to values that sold for less than or equal to 70% of the sticker price On the First Quarter Sales worksheet, rename the table FirstQuarter 17 2 18 Filter the data to display January, February, and March sales. 6 Grader - Instructions Excel 2019 Project 19 6 20 5 Add a footer with your name on the left side, the sheet name code in the center, and the file name code on the right side, Select Landscape orientation for all sheets Save and close EXP19_Excel_CH04_Cap Auto Sales.xlsx. Exit Excel Total Points 21 0 100 90% Vin H Date sold Sticker Price Sale Price % of sticker 2906934387 3/18/2021 $ 30,000.00 $30,000.00 100% 6393487147 9/27/2021 $ 30,000.00 $ 27,000.00 90% 9356019403 7/22/2021 $ 22,000.00 $ 13,200.00 60% 8000086254 7/1/2021 $ 30,000.00 $ 27,000.00 9340076442 12/31/2021 $ 34,000.00 $ 27,200.00 80% 7433901231 4/21/2021 $ 27,000.00 $ 16,200.00 60% 1328395941 1/31/2021 $ 25,000.00 $ 17,500.00 70% 8137529693 3/4/2021 $ 22,000.00 $ 19,800.00 90% 9650039042 10/16/2021 $ 30,000.00 $ 27,000.00 90% 1344751603 4/18/2021 $ 25,000.00 $ 25,000.00 100% 3732185591 6/15/2021 $ 27,000.00 $ 18,900.00 70% 8251440185 3/21/2021 $ 22,000.00 $ 19,800.00 90% 9414505869 8/6/2021 $ 30,000.00 $30,000.00 100% 4942016124 7/22/2021 $ 22,000.00 $ 15,400.00 70% 4094989639 9/20/2021 $ 22,000.00 $ 13,200.00 60% 4700777743 4/11/2021 $ 25,000.00 $ 22,500.00 90% 1380128961 1/6/2021 $ 34,000.00 $ 20,400.00 60% 3860813150 12/17/2021 $ 34,000.00 $ 30,600.00 90% 2069016783 8/3/2021 $ 27,000.00 $ 27,000.00 100% 2488607421 3/21/2021 $ 22,000.00 $ 19,800.00 90% 7541058788 6/1/2021 $ 22,000.00 $ 17,600.00 80% 3345743062 10/9/2021 $ 27,000.00 $ 21,600.00 80% 1889854267 1/25/2021 $ 34,000.00 $ 27,200.00 80% 8131908841 11/4/2021 $ 34,000.00 $ 23,800.00 70% 7679546980 11/2/2021 $ 40,000.00 $ 28,000.00 70% 100% 1360867906 1/22/2021 $ 22,000.00 $ 22,000.00 5739567111 5/29/2021 100% $ 22,000.00 $ 22,000.00 80% 6007144763 10/26/2021 $ 22,000.00 $ 17,600.00 3695501103 100% 2/14/2021 $ 22,000.00 $ 22,000.00 $ 785,000.00 $ 649,300.00 83% Total 2000 2009 Vin # Make 2906934387 BMW 6393487147 Honda 9356019403 Toyota 8000086254 BMW 9340076442 BMW 7433901231 Chevy 1328395941 Chevy 8137529693 BMW 9650039042 Ford 1344751603 Toyota 3732185591 BMW 8251440185 Ford 9414505869 Toyota 4942016124 Ford 4094989639 BMW 4700777743 BMW 1380128961 BMW 3860813150 Ford 2069016783 Honda 2488607421 BMW 7541058788 Chevy 3345743062 Ford 1889854267 BMW 8131908841 BMW 7679546980 BMW 1360867906 Chevy 5739567111 Honda 6007144763 BMW 3695501103 Ford 2482451414 Ford 7397531553 BMW 3133070112 Honda 5322014014 Ford 5726149503 Ford 4820173885 Ford 2706112648 BMW 7377188604 Ford 5293323010 Honda 2406189439 Honda 3578026701 Honda 1462643171 Toyota 5122993766 Toyota 7092958553 Chevy 8156049535 Honda Model 5 Series Civic Prius 5 Series 5 Series Malibu Malibu 5 Series F-150 Prius 5 Series F-150 Prius F-150 5 Series 5 Series 5 Series F-150 Civic 5 Series Malibu F-150 5 Series 5 Series 5 Series Malibu Civic 5 Series F-150 F-150 5 Series Civic F-150 F-150 F-150 5 Series F-150 Civic Civic Civic Prius Prius Malibu Civic Year Mileage Sticker Price 2015 25709 $ 30,000.00 2018 26609 $ 30,000.00 96905 $ 22,000.00 2017 28681 $30,000.00 2007 18384 $ 34,000.00 2010 37085 $ 27,000.00 2002 48868 $ 25,000.00 2001 61480 $ 22,000.00 2012 28541 $ 30,000.00 2004 42890 $ 25,000.00 2001 36595 $ 27,000.00 2011 76254 $ 22,000.00 2004 21380 $ 30,000.00 2006 63737 $ 22,000.00 2017 92048 $ 22,000.00 2017 44667 $ 25,000.00 2007 11158 $ 34,000.00 14095 $ 34,000.00 2014 34428 $ 27,000.00 2008 68172 $ 22,000.00 2011 77099 $ 22,000.00 2007 31562 $ 27,000.00 2012 14427 $ 34,000.00 2004 14966 $ 34,000.00 2010 7877 $ 40,000.00 2004 70797 $ 22,000.00 2013 99041 $ 22,000.00 2008 95344 $ 22,000.00 2015 99021 $ 22,000.00 2014 83281 $ 22,000.00 2018 36000 $ 27,000.00 2009 46323 $ 25,000.00 2011 46216 $ 25,000.00 2015 6971 $ 40,000.00 2016 6921 $ 40,000.00 2012 22089 $ 30,000.00 2016 52774 $ 22,000.00 2001 30840 $ 27,000.00 2010 49544 $25,000.00 2003 34825 $ 27,000.00 2006 8887 $ 40,000.00 2014 84930 $ 22,000.00 2014 11654 $ 34,000.00 2005 3997 $ 40,000.00 Step by Step Solution
There are 3 Steps involved in it
Step: 1

Get Instant Access to Expert-Tailored Solutions
See step-by-step solutions with expert insights and AI powered tools for academic success
Step: 2

Step: 3
Ace Your Homework with AI
Get the answers you need in no time with our AI-driven, step-by-step assistance
Get Started
Data Analytics Systems Engineering Cybersecurity Project Management
Authors: Christopher Greco
1st Edition
168392648X, 978-1683926481