Answered step by step
Verified Expert Solution
Question
1 Approved Answer
Jake, the owner of the Jake Automotive, wanted to examine the relationship between the number of cars that his sales associates sold and their
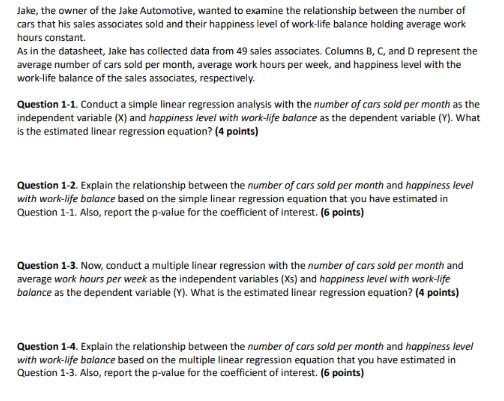
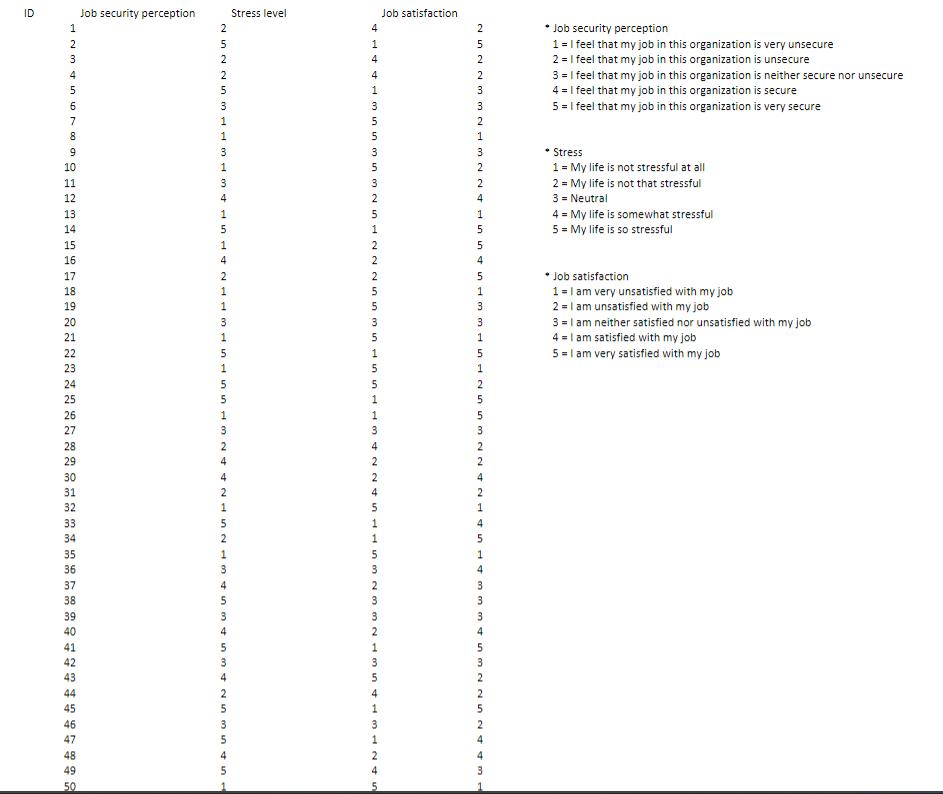

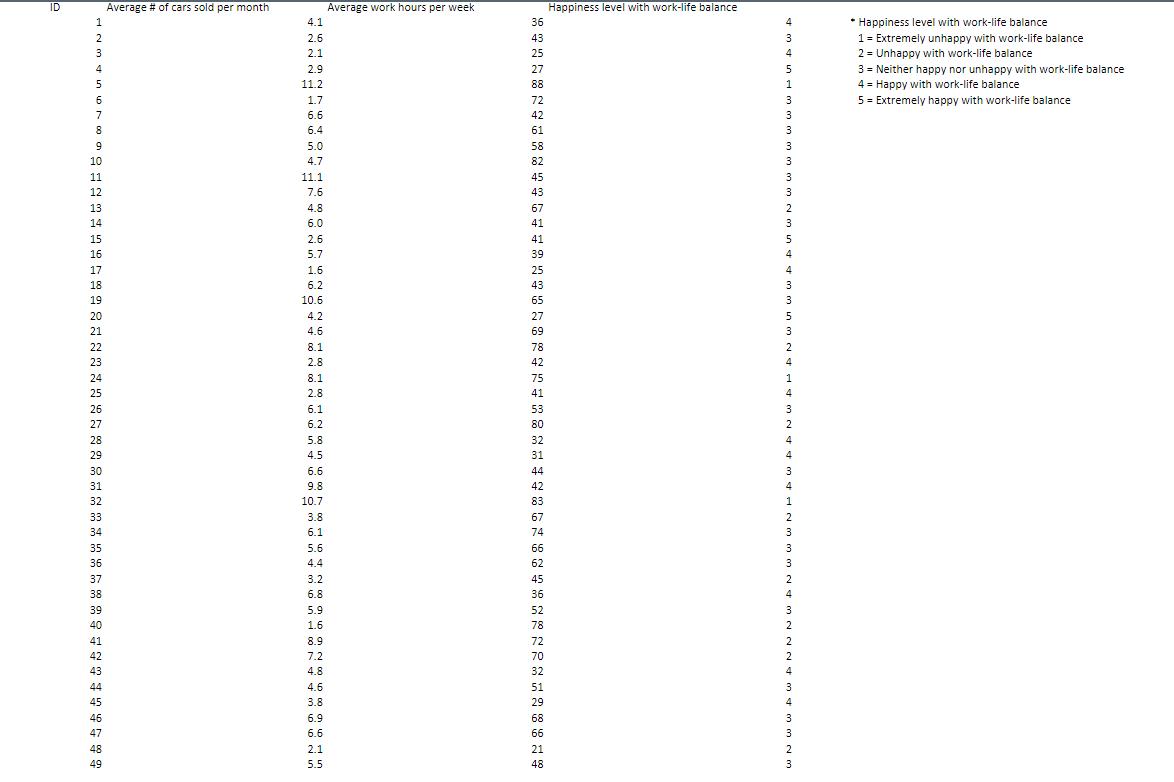
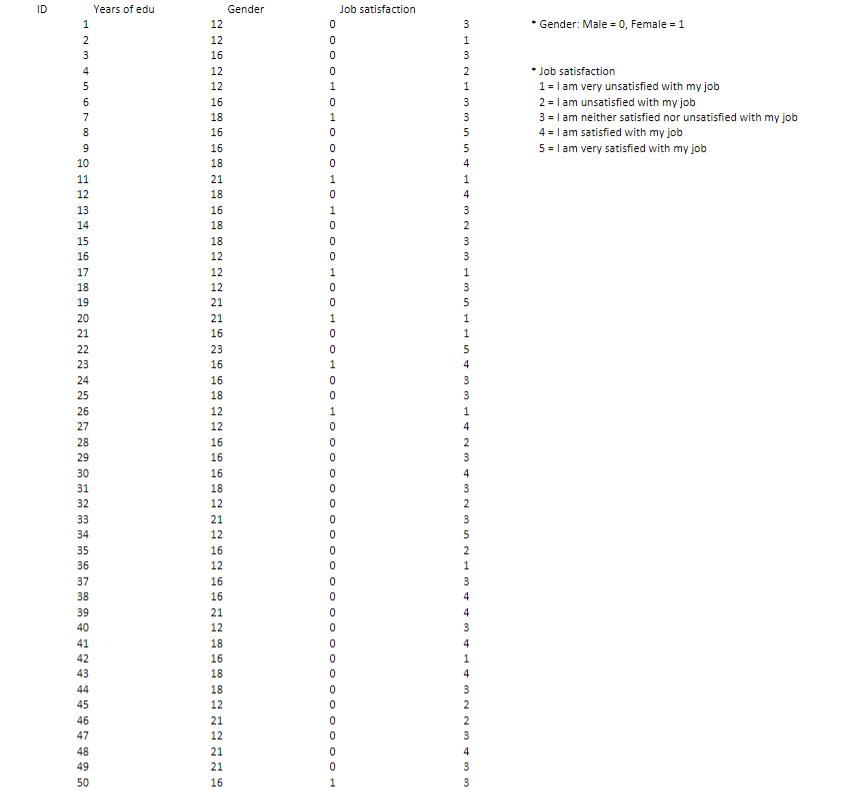
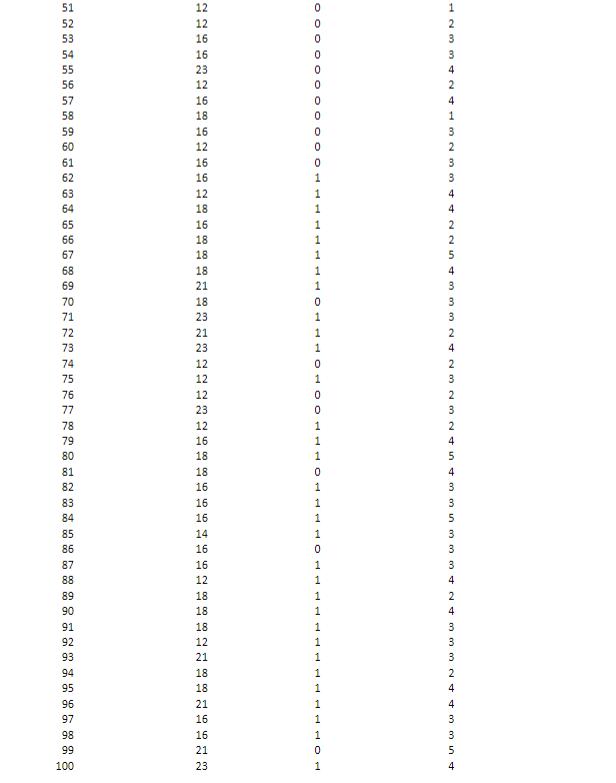
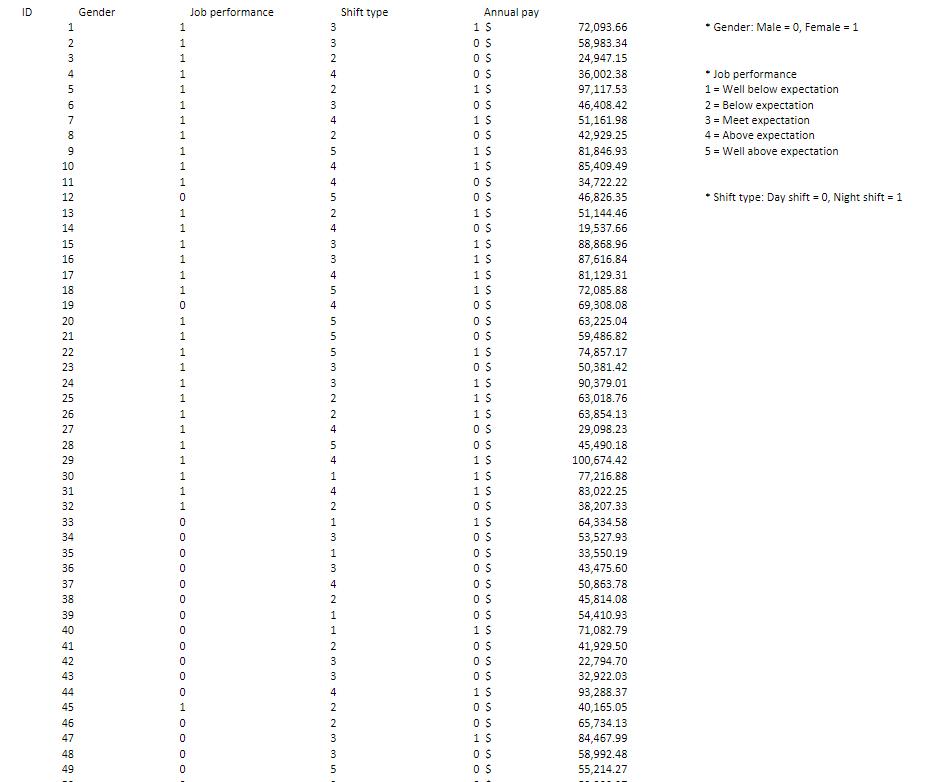
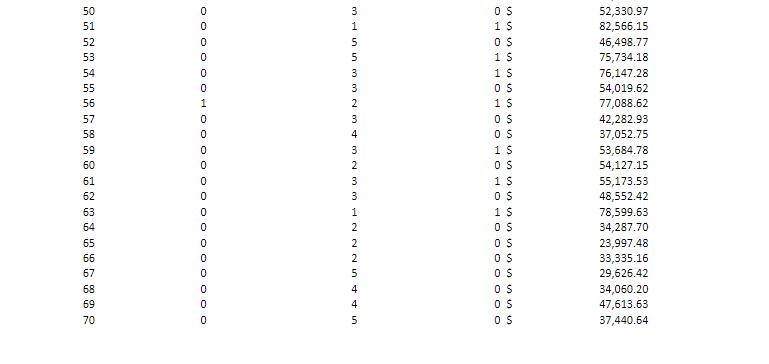
Jake, the owner of the Jake Automotive, wanted to examine the relationship between the number of cars that his sales associates sold and their happiness level of work-life balance holding average work hours constant. As in the datasheet, Jake has collected data from 49 sales associates. Columns B, C, and D represent the average number of cars sold per month, average work hours per week, and happiness level with the work-life balance of the sales associates, respectively. Question 1-1. Conduct a simple linear regression analysis with the number of cars sold per month as the independent variable (X) and happiness level with work-life balance as the dependent variable (Y). What is the estimated linear regression equation? (4 points) Question 1-2. Explain the relationship between the number of cars sold per month and happiness level with work-life balance based on the simple linear regression equation that you have estimated in Question 1-1. Also, report the p-value for the coefficient of interest. (6 points) Question 1-3. Now, conduct a multiple linear regression with the number of cars sold per month and average work hours per week as the independent variables (Xs) and happiness level with work-life balance as the dependent variable (Y). What is the estimated linear regression equation? (4 points) Question 1-4. Explain the relationship between the number of cars sold per month and happiness level with work-life balance based on the multiple linear regression equation that you have estimated in Question 1-3. Also, report the p-value for the coefficient of interest. (6 points) ID 5 6 6 5 6 6 R & D E S988285285NCENPE5555555ESSENT 10 11 12 13 14 15 16 17 18 19 20 21 23 24 26 27 30 31 32 33 34 35 36 37 38 39 40 42 43 44 45 46 47 48 49 50 Job security perception TSSOSNA WSA WSA WINSTNAANWHSSSWENDUA WH WENNUN 2 5 2 2 5 3 1 1 3 1 3 4 1 5 1 4 2 1 1 3 1 5 1 5 5 1 3 2 4 4 2 1 5 2 1 3 4 5 3 4 5 3 4 2 5 3 5 4 5 Stress level 4 1 4 4 H355 min 3 25 1 3 5 1 2 2 N55 2 5 354 in In IM INN It in 3 5 1 5 5 1 1 3 4 2 2 4 5 1 1 ONWSTE 5 3 2 3 3 2 1 354HMAN & S 1 1 2 4 Job satisfaction 2 -WAANUNNWSA w WWAHUDHNANNWUUUWWUNNWHNW WNNUN 5 2 2 2 1 3 2 2 4 1 5 5 4 5 1 3 3 1 5 1 2 5 5 3 2 2 4 2 4 5 1 4 3 3 3 4 5 3 2 2 5 2 4 4 *Job security perception 1 = I feel that my job in this organization is very unsecure 2 = I feel that my job in this organization is unsecure 3 = I feel that my job in this organization is neither secure nor unsecure 4 = I feel that my job in this organization is secure 5 = I feel that my job in this organization is very secure * Stress 1 = My life is not stressful at all 2 = My life is not that stressful 3 = Neutral 4 = My life is somewhat stressful 5 = My life is so stressful * job satisfaction 1 = I am very unsatisfied with my job 2 = 1 am unsatisfied with my job 3 = I am neither satisfied nor unsatisfied with my job 4= I am satisfied with my job 5=1 am very satisfied with my job 09 60 T9 62 62 63 63 64 99 ! 75 7 78 79 80 81 82 83 84 85 98 87 88 93 97 5343 242 ~ ~ ~MIG NANGING co W44SwuNUNU 3 54442 353N3N525 525NNAL NTNUTNPN ANTTIN ID 1 2 3 4 5 6 7 8 9 10 11 12 13 3 4 5 6 7 8 19 20 21 22 23 24 25 26 27 28 29 0 12345578 39 4 254454578 49 14 15 16 17 18 30 33 36 40 41 43 Average # of cars sold per month 46 4.1 2.6 2.1 2.9 11.2 1.7 6.6 6.4 5.0 4.7 11.1 7.6 4.8 6.0 0.0 2.6 5.7 1.6 6.2 10.6 4.2 .. 4.6 8.1 20 2.8 04 8.1 28 2.8 61 6.1 6.2 5.8 4.5 6.6 9.8 10.7 3.8 38 6.1 5.6 4.4 3.2 6.8 5.9 1.6 8.9 7.2 4.8 4.6 3.8 6.9 6.6 2.1 5.5 Average work hours per week 36 43 25 27 88 72 42 61 58 82 45 43 67 6/ 41 41 39 25 43 65 27 69 78 12 42 ar 75 41 53 53 80 32 31 44 42 83 67 74 66 62 45 36 52 78 72 70 32 51 29 68 66 21 48 Happiness level with work-life balance 3 4 5 1 3 3 3 3 3 3 3 2 3 5 4 4 3 3 5 3 2 4 1 4 3 2 4 4 3 4 1 2 3 3 3 2 4 3 2 2 2 4 3 4 3 3 2 3 * Happiness level with work-life balance 1 = Extremely unhappy with work-life balance 2 = Unhappy with work-life balance 3= Neither happy nor unhappy with work-life balance 4= Happy with work-life balance 5 = Extremely happy with work-life balance ID 1 2 3 4 5 6 7 8 9 10 11 12 13 14 15 16 17 18 19 20 21 22 23 24 25 26 27 28 29 30 31 32 33 34 35 36 37 38 39 40 41 42 43 44 45 46 47 48 49 50 Years of edu 12 22522680 12 16 12 12 16 18 16 16 18 21 18 16 18 18 12 12 12 21 21 16 23 16 16 18 12 12 16 16 IN556802 16 18 12 21 12 16 12 16 16 21 12 18 16 18 18 12 21 12 21 21 16 Gender 0 OOOTOOOOOOOOO 0 0 1 0 1 0 0 0 1 0 0 HOOHOOHOO 1 0 0 1 0 0 1 0 0 1 DOOOH 0 0 0 0 0 0 0 0 0 0 0 0 0 0 0 1000000 Job satisfaction 33 NH3 minis 1 2 1 3 5 5 4 1 4 32 33 1 4 min 3 5 1 1 5 4 3 3 1 4 23 4 3 2 3 5 213&&07 4 4 4 1 432N3 Ton m 4 3 3 * Gender: Male = 0, Female = 1 *Job satisfaction 1 = 1 am very unsatisfied with my job 2 = 1 am unsatisfied with my job 3 = I am neither satisfied nor unsatisfied with my job 4= I am satisfied with my job 5 = I am very satisfied with my job 51 52 53 58 59 60 61 63 62 62 63 64 64 65 65 66 99 67 68 69 70 71 2 75 75 76 77 78 79 80 81 82 83 84 84 85 85 98 86 87 87 88 89 89 06 30 91 91 92 24 93 94 95 96 97 98 66 100 18 18 16 18 18 18 23 12 LLLL 18 16 16 16 14 16 16 16 12 18 18 TT 1 2413 2 3 3 N54 3 3 3 NA N3 N 3 NASA335 33 3424 wowowo 24 43354 ID 1 2 3 4 5 6 7 8 9 10 11 12 13 14 15 16 17 18 19 20 21 22 23 24 25 26 27 28 29 30 31 32 33 34 35 36 37 38 39 40 41 42 43 44 45 46 47 48 49 Gender 1 1 1 1 1 1 1 1 1 1 1 0 1 1 1 1 OPPH 1 1 0 1 1 1 1 1 1 1 1 1 1 1 1 1 OOOOOOOOOOOOOOOOH 0 0 0 0 0 0 0 0 0 0 0 0 1 0 0 0 0 Job performance N3W 2 4 WHNAU AN N W win in WWANUAASNAWNA 2 3 4 2 5 4 4 5 2 4 3 3 4 i & in 5 4 5 5 5 3 3 2 4 5 4 1 4 2 1 3 1 3 4 2 1 WwNNAWWNA 1 2 3 3 4 2 2 3 3 5 Shift type Annual pay 1 S OS OS OS 1 S OS 1 S OS 1 S 1 S OS OS 1 S OS 1 S 1 S 1 S 1 S OS OS OS 1 S OS 1 S 1 S 1 S OS OS 1 S 1 S 1 S OS 1 S OS OS OS OS OS OS 1 S OS OS OS 1 S OS OS 1 S OS OS 72,093.66 58,983.34 24,947.15 36,002.38 97,117.53 46,408.42 51,161.98 42,929.25 81,846.93 85,409.49 34,722.22 46,826.35 51,144.46 19,537.66 88,868.96 87,616.84 81,129.31 72,085.88 69,308.08 63,225.04 59,486.82 74,857.17 50,381.42 90,379.01 63,018.76 63,854.13 29,098.23 45,490.18 100,674.42 77,216.88 83,022.25 38,207.33 64,334.58 53,527.93 33,550.19 43,475.60 50,863.78 45,814.08 54,410.93 71,082.79 41,929.50 22,794.70 32,922.03 93,288.37 40,165.05 65,734.13 84,467.99 58,992.48 55,214.27 * Gender: Male = 0, Female = 1 *Job performance 1 = Well below expectation 2= Below expectation 3= Meet expectation 4 = Above expectation 5 = Well above expectation *Shift type: Day shift = 0, Night shift = 1 50 51 52 53 54 55 56 57 58 288988283285 09 61 62 63 64 65 66 68 69 70 0 OOOOOOOOOOOOOOOOOOOO 0 0 0 0 0 1 0 0 0 0 0 0 0 0 0 0 0 0 0 0 3 MIn 3 MN MMNM MANNI 1 5 5 3 2 3 4 3 2 3 3 1 2 2 2 5 4 4 5 OHOHOHOOHOHOHOOOOOOO isisisis is is is is is isisisisisisisis Sisss OS 1 S OS 1 S 1 S OS 1 $ OS OS 1 $ OS 1 S OS 1 S OS OS OS OS OS OS OS 52,330.97 82,566.15 46,498.77 75,734.18 76,147.28 54,019.62 77,088.62 42,282.93 37,052.75 53,684.78 54,127.15 55,173.53 48,552.42 78,599.63 34,287.70 23,997.48 33,335.16 29,626.42 34,060.20 47,613.63 37,440.64
Step by Step Solution
★★★★★
3.43 Rating (153 Votes )
There are 3 Steps involved in it
Step: 1
It seems you have provided a set of data and questions regarding the relationship between the number of cars sold per month average work hours per wee...
Get Instant Access to Expert-Tailored Solutions
See step-by-step solutions with expert insights and AI powered tools for academic success
Step: 2

Step: 3

Ace Your Homework with AI
Get the answers you need in no time with our AI-driven, step-by-step assistance
Get Started


