just need help with part B
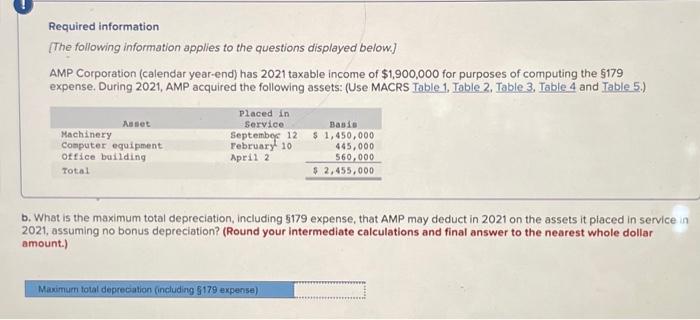
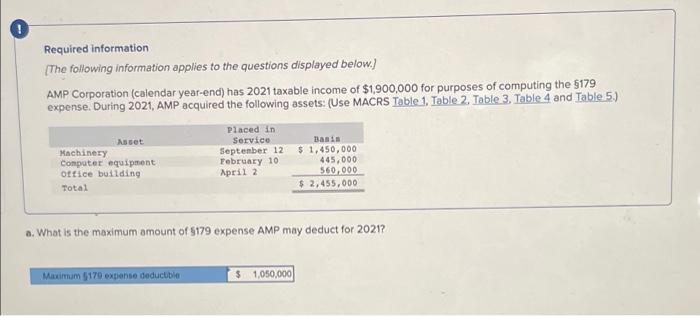
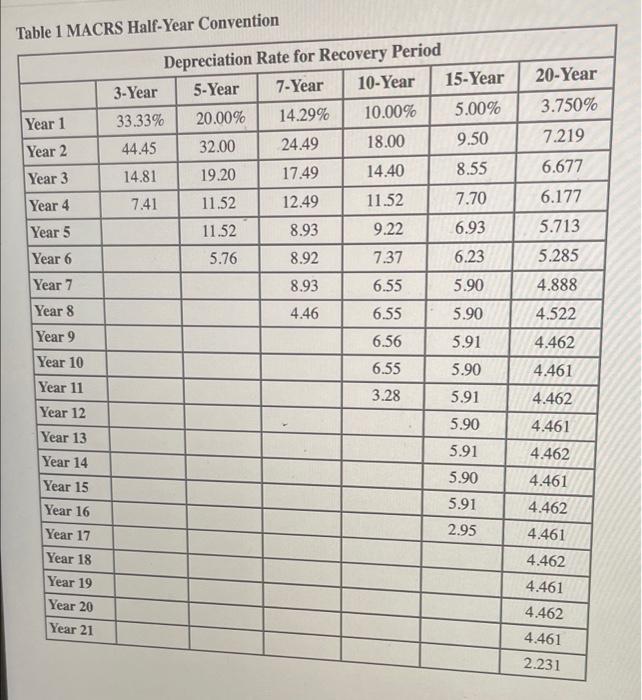
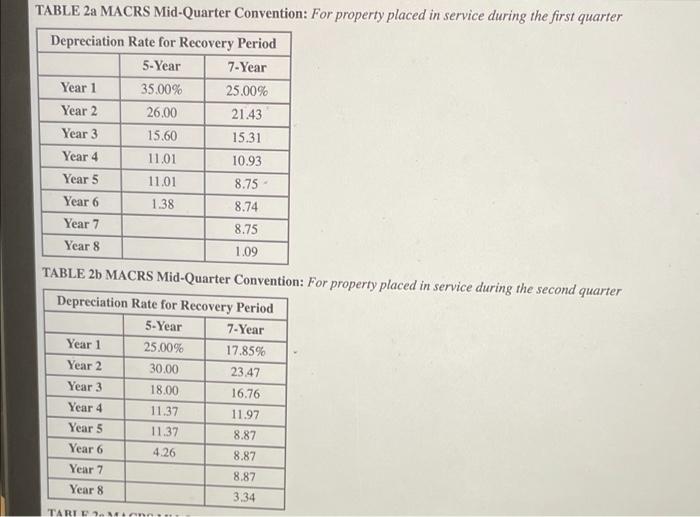
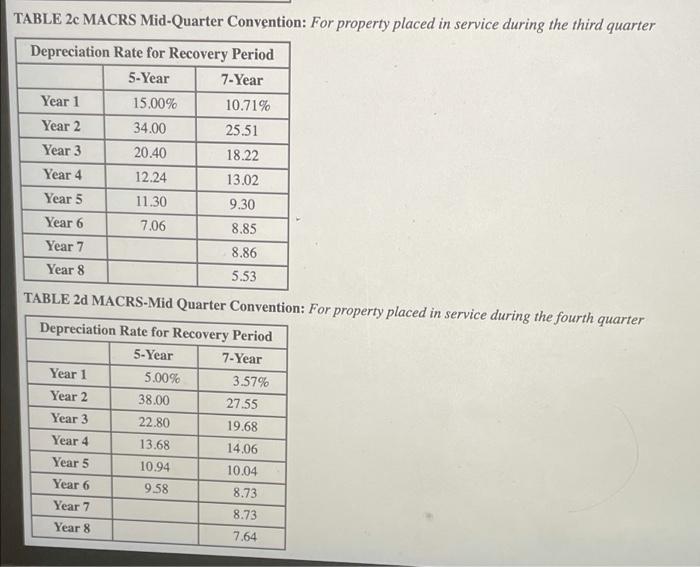
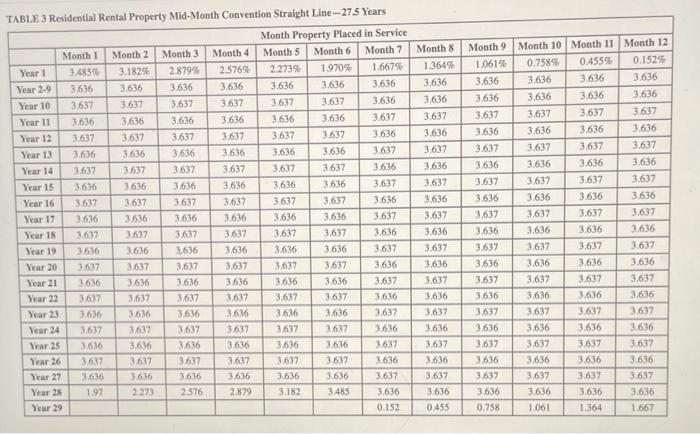
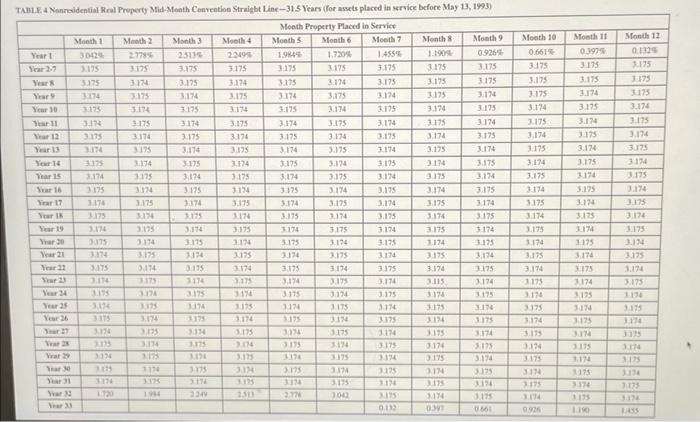
Required information {The following information applies to the questions displayed below.) AMP Corporation (calendar year-end) has 2021 taxable income of $1,900,000 for purposes of computing the $179 expense. During 2021, AMP acquired the following assets: (Use MACRS Table 1. Table 2. Table 3. Table 4 and Table 5.) Auset Machinery Computer equipment Office building Total Placed in Service September 12 Tebruary 10 April 2 Basis $ 1,450,000 445,000 560,000 $2,455,000 b. What is the maximum total depreciation, including 5179 expense, that AMP may deduct in 2021 on the assets it placed in service in 2021, assuming no bonus depreciation? (Round your intermediate calculations and final answer to the nearest whole dollar amount.) Maximum total depreciation (including 5179 expense) Required information [The following information applies to the questions displayed below.) AMP Corporation (calendar year-end) has 2021 taxable income of $1,900,000 for purposes of computing the $179 expense. During 2021, AMP acquired the following assets: (Use MACRS Toble 1. Toble 2. Table 3. Table 4 and Table 5.) Placed in Asset Service Basis Machinery September 12 $ 1,450,000 Computer equipment February 10 445.000 office building April 2 560,000 Total $ 2,455,000 a. What is the maximum amount of 5179 expense AMP may deduct for 2021? Maximum 5170 expense deducible $ 1,050,000 Table 1 MACRS Half-Year Convention 20-Year 3.750% 7.219 Year 1 Year 2 Depreciation Rate for Recovery Period 3-Year 5-Year 7-Year 10-Year 15-Year 33.33% 20.00% 14.29% 10.00% 5.00% 44.45 32.00 24.49 18.00 9.50 14.81 19.20 17.49 14.40 8.55 7.41 11.52 12.49 11.52 7.70 11.52 8.93 9.22 6.93 5.76 8.92 7.37 6.23 6.677 Year 3 Year 4 Year 5 6.177 5.713 5.285 Year 6 8.93 6.55 5.90 4.888 Year 7 Year 8 4.46 6.55 5.90 4.522 Year 9 6.56 5.91 Year 10 Year 11 4.462 4.461 6.55 5.90 3.28 5.91 Year 12 4.462 4.461 5.90 Year 13 5.91 Year 14 Year 15 Year 16 5.90 5.91 2.95 4.462 4.461 4.462 4.461 Year 17 Year 18 Year 19 Year 20 Year 21 4.462 4.461 4.462 4.461 2.231 TABLE 2a MACRS Mid-Quarter Convention: For property placed in service during the first quarter Depreciation Rate for Recovery Period 5-Year 7-Year Year 1 35.00% 25.00% Year 2 26.00 21.43 Year 3 15.60 15.31 Year 4 11.01 10.93 Year 5 11.01 8.75 Year 6 1.38 8.74 Year 7 8.75 Year 8 1.09 TABLE 26 MACRS Mid-Quarter Convention: For property placed in service during the second quarter Depreciation Rate for Recovery Period 5-Year 7-Year Year 1 25.00% 17.85% Year 2 30.00 23.47 Year 3 18.00 16.76 Year 4 11.37 11.97 Year 5 11.37 8.87 Year 6 4.26 8.87 Year 7 8.87 Year 8 3.34 TARIE TABLE 2 MACRS Mid-Quarter Convention: For property placed in service during the third quarter Depreciation Rate for Recovery Period 5-Year 7-Year Year 1 15.00% 10.71% Year 2 34.00 25.51 Year 3 20.40 18.22 Year 4 12.24 13.02 Year 5 11.30 9.30 Year 6 7.06 8.85 Year 7 8.86 Year 8 5.53 TABLE 2d MACRS-Mid Quarter Convention: For property placed in service during the fourth quarter Depreciation Rate for Recovery Period 5-Year 7-Year Year 1 5.00% 3.57% Year 2 38.00 27.55 Year 3 22.80 19.68 Year 4 13.68 14.06 Year 5 10.94 10.04 Year 6 9.58 8.73 Year 7 8.73 Year 8 7.64 E E E E E E E 99 TABLE 3 Residential Rental Property Mid-Month Convention Straight Line --27.5 Years Month Property Placed in Service Month 1 Month 2 Month 3 Month 4 Month 5 Month 6 Month 7 Year 3.4859 3.1825 2.8799 2576% 2.2736 1.9705 1.6679 Year 2-9 3.636 3.636 3.636 3.636 3.636 3.636 3.636 Year 10 3.637 3.637 3.637 3.637 3,637 3.637 3.636 Year 11 3.636 3.636 3.636 3.636 3.636 3.636 3.637 Year 12 3.637 3.637 3.637 3.637 3.637 3.637 3.636 Year 13 3.636 3.636 3,636 3,636 3.636 3.636 3.637 Year 14 3.637 3.637 3.637 3637 3.637 3.637 3.636 Year 15 3.636 3.636 3.636 3.636 3,636 3.636 3.637 Year 16 3.637 3.637 3.637 3.637 3.637 3.637 3.636 Year 17 3.636 3.636 3.636 3.636 3.636 3.636 3.637 Year 18 3.637 3.637 3637 3.637 3.637 3,637 3.636 Year 19 3.636 3.636 3636 3.636 3,636 3.636 3.637 Year 20 3.637 3,637 3,637 3.637 3,637 3.637 3.636 Year 21 3.636 3.636 3.636 3.636 3.636 3.636 3.637 Year 22 3637 3.637 3637 3.637 3,637 3,637 3.636 Year 13 3.636 3.636 3.636 3.636 3636 3636 3,637 Year 24 3637 3637 3.637 3.637 3637 3.637 3.636 Year 25 3.636 3.636 3.636 3.636 3,636 3.636 3.637 Year 26 3637 3.637 3.637 3.617 3637 3,637 3,636 Year 27 3.636 3.636 3636 3.636 3.636 3.636 3.637 Year 28 1.97 2.273 2576 2879 3.182 3.485 3,636 Year 29 0.152 Month 8 1.364% 3636 3.636 3.637 3.636 3.637 3.636 3,637 3.636 3.637 636 3.637 3.636 3.637 3.636 3.637 3.636 3.637 3.636 3.637 3.636 0,455 Month 9 Month 10 Month 11 Month 12 1.0619 0.75896 0.4555 0.1525 3.636 3.636 3.636 3.636 3.636 3.636 3.636 3.636 3.637 3.637 3.637 3.637 3.636 3.636 3.636 3.636 3,637 3.637 3.637 3.637 3636 3.636 3.636 3.636 3.637 3,637 3.637 3,637 3.636 3.636 3.636 3.636 3.637 3.637 3.637 3.637 3.636 3.636 3.636 3.636 3.63% 3.637 3.637 3,637 3.636 3.636 3.636 3.636 3.637 3,637 3.637 3.637 3.636 3.636 3.636 3.636 3.637 3.637 3,637 3.637 3.636 3.636 3.636 3.636 3,637 3.637 3.637 3.631 3.636 3,636 3.636 3.636 3.637 3,637 3,637 3.637 3.636 3.636 3.636 0.758 1.061 1.364 1.667 E 3.636 Months 11 0397 3175 Month 12 0.120 3.175 SZE 3174 Month 10 0.6615 3.175 3.175 3175 3.14 2175 3.174 3175 3174 3.174 3175 SETE 3.174 3175 3.174 3.175 15 3.174 3.175 3.174 3.175 3174 3.175 3.133 3.175 3.14 SLEE PIC 3.175 SLIC SZIE LIC TABLE4 Nonresidential Real Property Mid-Month Convention Straight Line-315 Years for assets placed in service before May 13, 1993) Month Property Placed in Service Month Mech2 Month 3 Month 4 Month Month 6 Month 7 Month Month Yeart 3042 2778 1984 1.720 1455 0926% 3175 3:175 3.175 3.175 3.175 3.175 3.175 3.175 3.175 Years 3.175 3174 3.175 3.194 3.175 3.174 3.175 3.175 3.175 Year 3.174 3.175 3174 3.175 3.175 3.174 1195 3.174 Year 10 3175 3124 3174 1.175 3.174 3.175 3.174 3175 Year 11 3.175 3.174 3.175 3.174 3.175 3.174 3.175 3.174 Year 12 3175 3174 3:175 3194 3.175 3.174 3.175 3.174 3.125 Year 3175 3.174 3.125 3.174 3.175 1174 3.175 3.174 Ver 1 3.174 3.175 1174 3.175 3.14 3.175 3.175 Year 15 3.174 3175 3.174 3.175 3.174 9.175 3.174 3.175 3.174 Svar 16 3:14 3.174 3.175 3.175 Var 17 3170 3.175 3174 3.175 3.174 3.175 3.174 1.175 3.174 3.175 3.174 3.175 7.174 3.175 3.174 3.175 3.114 3.175 1174 3.175 3.174 5.174 3075 3174 3.115 1174 3.175 3.174 1.175 1174 3.175 Year 21 3.175 1176 31175 3.174 3175 3.174 3175 3.174 Year 11 3175 3.174 31175 3.174 3.173 3174 3.174 3175 3114 3174 3.175 3.174 1175 3.174 1.115 3174 Year 34 1.175 1175 3175 3:14 3.175 3.194 3175 114 3174 3.10 Ver 36 31S 2014 117 3114 1.125 319 3.175 3124 1.175 Bar 14 3175 3175 3114 3.115 33114 3175 3.174 3.175 Var > 11 3.175 3194 195 3.194 1170 3775 3.75 3.174 3115 311 3125 1134 3.175 3.136 125 14 234 2.50 2776 1195 317 3135 9.113 0861 1174 3.175 3.174 SLIE 3.175 3.174 2175 3174 3.175 1174 1.175 PIC SLEE 1175 3174 175 1174 1125 3174 3175 1.175 1.174 3.175 3.174 1175 3114 3175 3174 3198 SERE PIE SLIE SIE 3175 11 CIE TIL VLIE SLIE PE 115 3.174 1125 3.175 3.174 1175 3.174 PEC YLIE PE 7173 HE CHE 3175 2014 993 LACO FEE SSH 110 TABLE 5 Numresidential Real Property Mid-Month Convention Straight Line-39 Years (for assets placed in service on or after May 13, 1993) Month Property Placed in Service Month Month 2 Month 3 Month Months Month Month 7 Month 8 Month 2.4618 2013 18195 1.6055 1.1914 0.963 0,7498 Ver 3-39 2564 2.564 2565 2564 2564 2564 Suar 0107 01121 0535 0.749 0.963 1.177 1391 1.605 1.819 Month 10 0.5555 2564 Month 11 0.3213 2564 Manth 12 0.1073 2564 2.033 26247 2.461
