Answered step by step
Verified Expert Solution
Question
1 Approved Answer
Letting p be the selling price per unit, v= $65 be the variable cost per unit and /= $400,000 be the fixed costs per

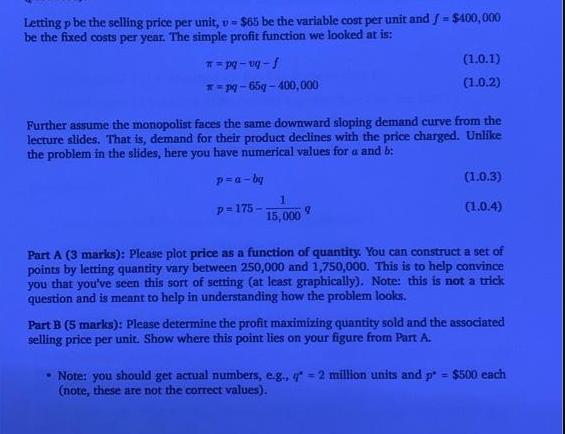
Letting p be the selling price per unit, v= $65 be the variable cost per unit and /= $400,000 be the fixed costs per year. The simple profit function we looked at is: quaf * pq-65g-400,000 (1.0.1) (1.0.2) Further assume the monopolist faces the same downward sloping demand curve from the lecture slides. That is, demand for their product declines with the price charged. Unlike the problem in the slides, here you have numerical values for a and b: p=a-bg p=175- 1 15,000 (1.0.3) (1.0.4) Part A (3 marks): Please plot price as a function of quantity. You can construct a set of points by letting quantity vary between 250,000 and 1,750,000. This is to help convince you that you've seen this sort of setting (at least graphically). Note: this is not a trick question and is meant to help in understanding how the problem looks. Part B (5 marks): Please determine the profit maximizing quantity sold and the associated selling price per unit. Show where this point lies on your figure from Part A. Note: you should get actual numbers, e.g., q=2 million units and p = $500 each (note, these are not the correct values).
Step by Step Solution
★★★★★
3.51 Rating (148 Votes )
There are 3 Steps involved in it
Step: 1
To plot the price as a function of quantity well use the demand curve equation p 175 115000 q Lets v...
Get Instant Access to Expert-Tailored Solutions
See step-by-step solutions with expert insights and AI powered tools for academic success
Step: 2

Step: 3

Ace Your Homework with AI
Get the answers you need in no time with our AI-driven, step-by-step assistance
Get Started


