Answered step by step
Verified Expert Solution
Question
1 Approved Answer
Lydex Company's financial statements for the last two years are as follows: Lydex Company Comparative Balance Sheet Assets Current assets: Cash Marketable securities Accounts


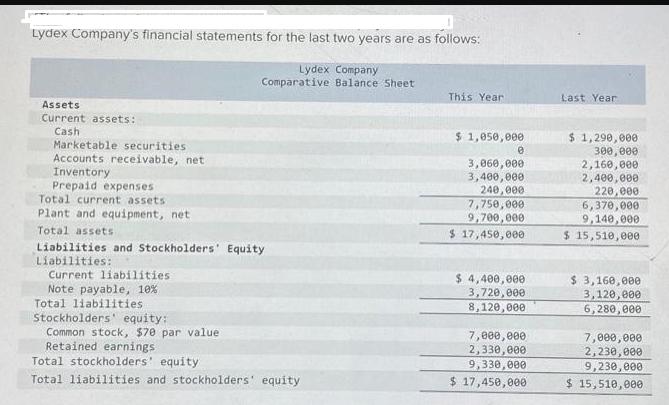
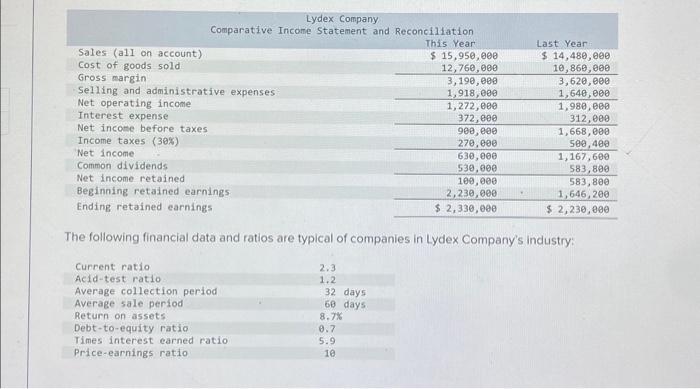
Lydex Company's financial statements for the last two years are as follows: Lydex Company Comparative Balance Sheet Assets Current assets: Cash Marketable securities Accounts receivable, net Inventory Prepaid expenses Total current assets Plant and equipment, net Total assets Liabilities and Stockholders' Equity Liabilities: Current liabilities Note payable, 10% Total liabilities Stockholders equity: Common stock, $70 par value Retained earnings Total stockholders' equity Total liabilities and stockholders' equity This Year $ 1,050,000 3,060,000 3,400,000 240,000 7,750,000 9,700,000 $ 17,450,000 e $ 4,400,000 3,720,000 8,120,000 7,000,000 2,330,000 9,330,000 $ 17,450,000 Last Year $ 1,290,000 300,000 2,160,000 2,400,000 220,000 6,370,000 9,140,000 $ 15,510,000 $ 3,160,000 3,120,000 6,280,000 7,000,000 2,230,000 9,230,000 $ 15,510,000 Lydex Company Comparative Income Statement and Reconciliation. This Year $ 15,950,000 12,760,000 3,190,000 1,918,000 1,272,000 372,000 900,000 270,000 630,000 530,000 100,000 2,230,000 $ 2,330,000 Sales (all on account). Cost of goods sold Gross margin Selling and administrative expenses Net operating income Interest expense Net income before taxes Income taxes (30%) Net income Common dividends Net income retained Beginning retained earnings Ending retained earnings The following financial data and ratios are typical of companies in Lydex Company's industry: Current ratio Acid-test ratio. Average collection period Average sale period. Return on assets: Debt-to-equity ratio Times interest earned ratio Price-earnings ratio. 2.3 1.2 32 days 60 days 8.7% Last Year: $ 14,480,000 10,860,000 3,620,000 1,640,000 0.7 5.9 10 1,980,000 312,000 1,668,000 500,400 1,167,600 583,800 583,800 1,646,200 $ 2,230,000 Required: 1. To assess the company's performance in terms of debt management and profitability, compute the following for this year and last year: Note: Round your "Percentage" answers to 1 decimal place and other answers to 2 decimal places. a. The times interest earned ratio. b. The debt-to-equity ratio. c. The gross margin percentage. d. The return on total assets. (Total assets at the beginning of last year were $13,160,000.) e. The return on equity. (Stockholders' equity at the beginning of last year totaled $8,646,200. There has been no change in common stock over the last two years.) 1. Is the company's financial leverage positive or negative?
Step by Step Solution
★★★★★
3.47 Rating (147 Votes )
There are 3 Steps involved in it
Step: 1
Times interest earned ratio This can be calculated as Earnings before interest and income taxes Inte...
Get Instant Access to Expert-Tailored Solutions
See step-by-step solutions with expert insights and AI powered tools for academic success
Step: 2

Step: 3

Ace Your Homework with AI
Get the answers you need in no time with our AI-driven, step-by-step assistance
Get Started


