Answered step by step
Verified Expert Solution
Link Copied!

Question

1 Approved Answer

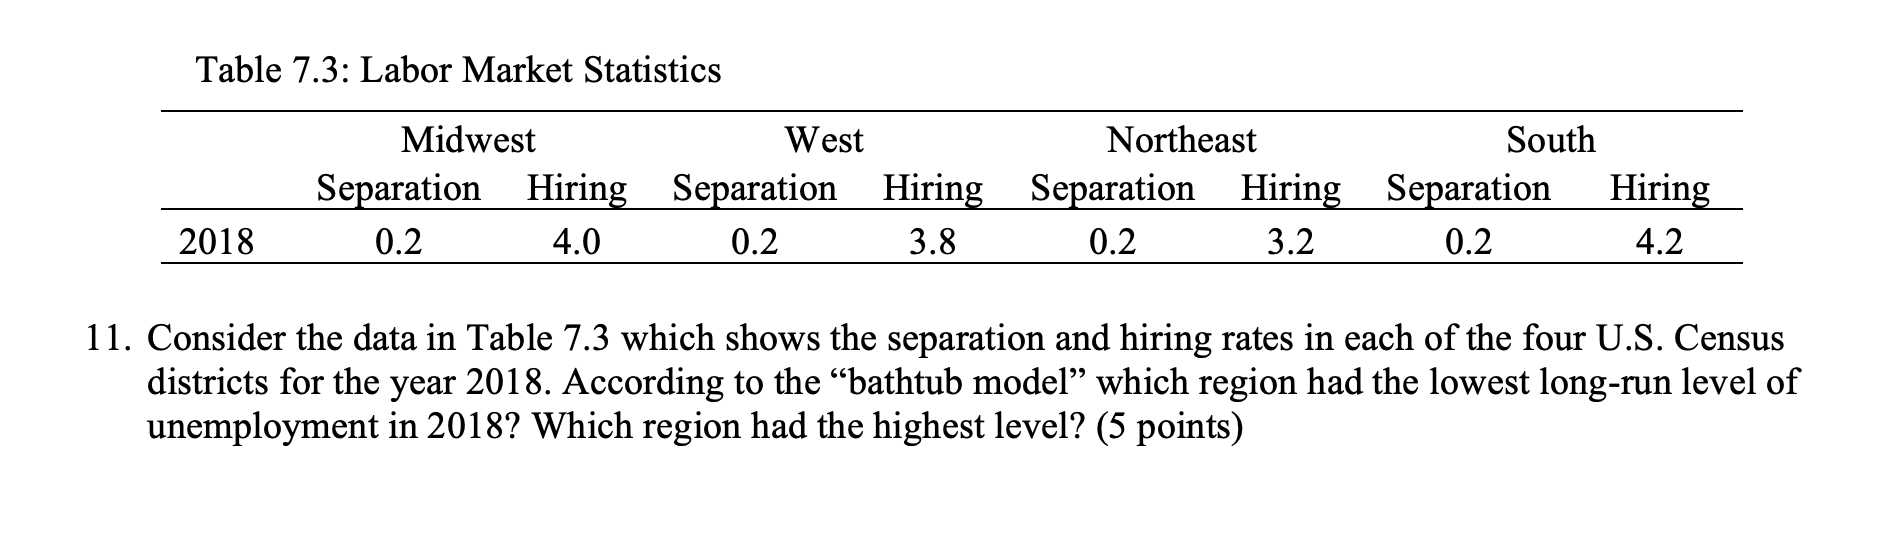
macroeconomics bathrub model Table 7.3: Labor Market Statistics Midwest West Northeast South Separation Hiring Separation Hiring SeQaration Hiring Separation Hiring 2018 0.2 4.0 0.2 3.8

macroeconomics bathrub model

image text in transcribed
Table 7.3: Labor Market Statistics Midwest West Northeast South Separation Hiring Separation Hiring SeQaration Hiring Separation Hiring 2018 0.2 4.0 0.2 3.8 0.2 3.2 0.2 4.2 11. Consider the data in Table 7.3 which shows the separation and hiring rates in each of the four U.S. Census districts for the year 2018. According to the \"bathtub model\" which region had the lowest long-run level of unemployment in 2018? Which region had the highest level? (5 points)

Step by Step Solution

There are 3 Steps involved in it

Step: 1

blur-text-image

Get Instant Access to Expert-Tailored Solutions

See step-by-step solutions with expert insights and AI powered tools for academic success

Step: 2

blur-text-image

Step: 3

blur-text-image

Ace Your Homework with AI

Get the answers you need in no time with our AI-driven, step-by-step assistance

Get Started

Recommended Textbook for

Exploring Economics

Authors: Robert L Sexton

5th Edition

978-1439040249, 1439040249

More Books

Students also viewed these Economics questions

Question

=+ d. What happens to Oceanias trade balance?

Answered: 1 week ago