

Answered step by step
Verified Expert Solution
Question
1 Approved Answer
Mak a histogram using Zoom Stat on your calculator. Use the histogram to construct the frequencey table below. Make sure to lable the table columns
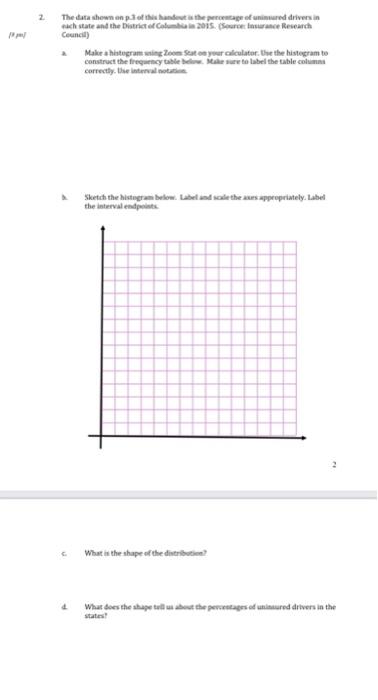
Mak a histogram using Zoom Stat on your calculator. Use the histogram to construct the frequencey table below. Make sure to lable the table columns correctly. Use interval notation. 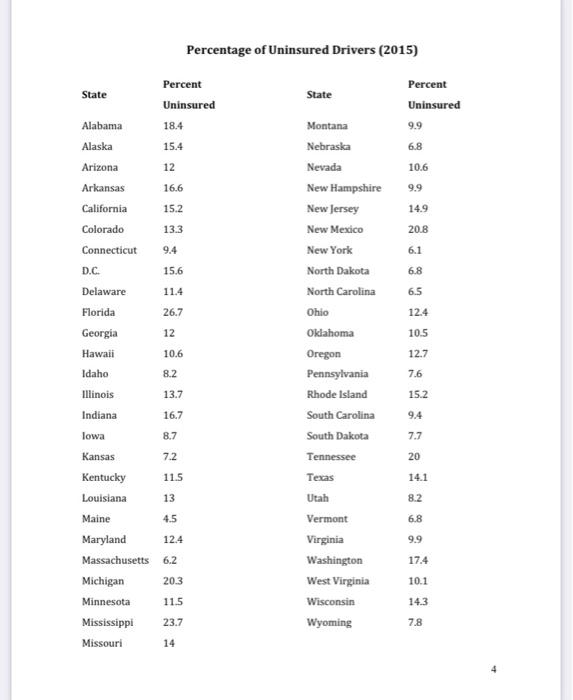
,,
Percentage of Uninsured Drivers (2015) State Percent Uninsured 9.9 6.8 10.6 9.9 14.9 20.8 6.1 6.8 6.5 12.4 10.5 12.7 Percent State Uninsured Alabama 18.4 Alaska 15.4 Arizona 12 Arkansas 16.6 California 15.2 Colorado 13.3 Connecticut 9.4 D.C 15.6 Delaware 11.4 Florida 26.7 Georgia 12 Hawaii 10.6 Idaho 8.2 Illinois 13.7 Indiana 16.7 lowa 8.7 Kansas 7.2 Kentucky 11.5 Louisiana 13 Maine 4.5 Maryland 12.4 Massachusetts 6.2 Michigan 203 Minnesota 11.5 Mississippi 23.7 Missouri 14 Montana Nebraska Nevada New Hampshire New Jersey New Mexico New York North Dakota North Carolina Ohio Oklahoma Oregon Pennsylvania Rhode Island South Carolina South Dakota Tennessee Texas Utah Vermont Virginia Washington West Virginia Wisconsin Wyoming 76 15.2 9.4 7.7 20 14.1 8.2 6.8 99 17.4 10.1 14.3 7.8 2 The data shown an phan the percentage of red drivers in each state and the District of Column 2015. Sare Insurance Research Council Make a histogramming Zoom Sto your calculator. Use the histogram to construct the frequency table et label the table comme correctly the interval Sketch the stugan below. Label and code the ans appropriately. Label the intervalent What is the shape of the diverse 4 What does the shape to be the percentages et uninsured drivers in the Percentage of Uninsured Drivers (2015) State Percent Uninsured 9.9 6.8 10.6 9.9 14.9 20.8 6.1 6.8 6.5 12.4 10.5 12.7 Percent State Uninsured Alabama 18.4 Alaska 15.4 Arizona 12 Arkansas 16.6 California 15.2 Colorado 13.3 Connecticut 9.4 D.C 15.6 Delaware 11.4 Florida 26.7 Georgia 12 Hawaii 10.6 Idaho 8.2 Illinois 13.7 Indiana 16.7 lowa 8.7 Kansas 7.2 Kentucky 11.5 Louisiana 13 Maine 4.5 Maryland 12.4 Massachusetts 6.2 Michigan 203 Minnesota 11.5 Mississippi 23.7 Missouri 14 Montana Nebraska Nevada New Hampshire New Jersey New Mexico New York North Dakota North Carolina Ohio Oklahoma Oregon Pennsylvania Rhode Island South Carolina South Dakota Tennessee Texas Utah Vermont Virginia Washington West Virginia Wisconsin Wyoming 76 15.2 9.4 7.7 20 14.1 8.2 6.8 99 17.4 10.1 14.3 7.8 2 The data shown an phan the percentage of red drivers in each state and the District of Column 2015. Sare Insurance Research Council Make a histogramming Zoom Sto your calculator. Use the histogram to construct the frequency table et label the table comme correctly the interval Sketch the stugan below. Label and code the ans appropriately. Label the intervalent What is the shape of the diverse 4 What does the shape to be the percentages et uninsured drivers in theStep by Step Solution
There are 3 Steps involved in it
Step: 1

Get Instant Access to Expert-Tailored Solutions
See step-by-step solutions with expert insights and AI powered tools for academic success
Step: 2

Step: 3
Ace Your Homework with AI
Get the answers you need in no time with our AI-driven, step-by-step assistance
Get Started
Stock Market Investing For Beginners A Simple Guide To Navigating Wall Street
Authors: K. Connors
1st Edition
1090253184, 978-1090253187