

Question: MATLAB help: I need help solving part 4,5 and 6. I already have the first 3 parts. R1.1) clc clear all f=1/2; A=2; theta=0; offset=-1;
MATLAB help:
I need help solving part 4,5 and 6. I already have the first 3 parts.
R1.1)
clc clear all f=1/2; A=2; theta=0; offset=-1; duration=10; sampleRate=1000; maxSamp=duration*sampleRate; t=(1:maxSamp)/sampleRate;
y1=A*cos(2*pi*f*t+theta)+offset; A=1; f=1 theta=pi/2; offset=0; y2=A*cos(2*pi*f*t+theta)+offset; plot(t,y1,'b',t,y2,'r'); xlabel('time(s)'); ylabel('amplitude'); legend('R(1.1)','Original');
--------
(R1.2)
clc clear all f=1; A=1; theta=pi/2; offset=0; duration=10; sampleRate=1000; maxSamp=duration*sampleRate; t=(1:maxSamp)/sampleRate;
y1=A*cos(2*pi*f*t+theta)+offset; theta=-0.3/pi; y2=A*cos(2*pi*f*t+theta)+offset; plot(t,y1,'b',t,y2,'r'); xlabel('time(s)'); ylabel('amplitude'); legend('R(1.2)','Original');
--------------------------------
R1.3)
clc clear all f=5; A=-3/(sqrt(2)); theta=0; offset=0; duration=2; sampleRate=1000; maxSamp=duration*sampleRate; t=(1:maxSamp)/sampleRate;
y1=A*cos(2*pi*f*t+theta)+offset; A=3/(sqrt(2)); y2=A*sin(2*pi*f*t+theta)+offset; y3=y1+y2; plot(t,y1,'b',t,y2,'r'); hold on; plot(t,y3,'g') xlabel('time(s)'); ylabel('amplitude'); legend('R(1.3) sine','R(1.3) cose','Combined');
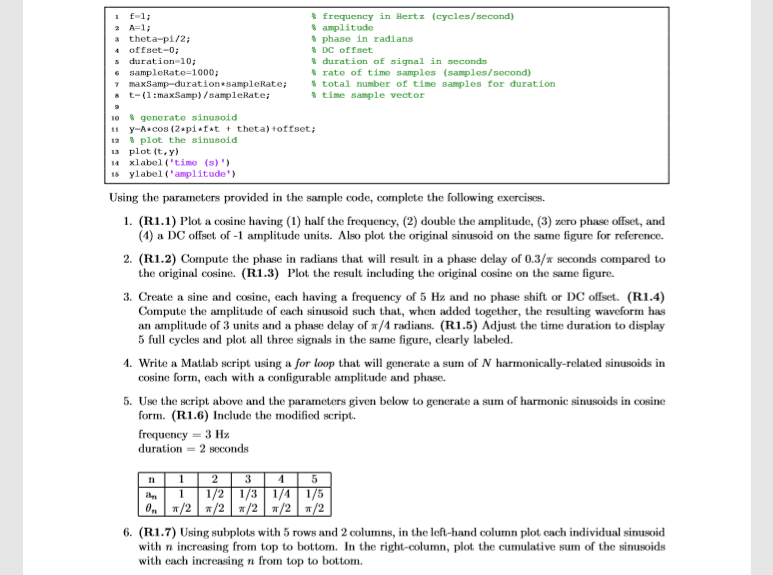
F-1: A-1; amplitude % phase in radians % DC offset % duration of tignal in seconds % rate of time samples (samples/second) % total number of time Bangles for duration % time sample vector s theta-pi/2; offset-D s duration 10; 6 sampleRate-1000 maxsamp-durationsampleRate; a t-(1maxSamp) /sampleRate; 10 % generate sinusoid 1 y-A cos (2 pifat theta) toffset; 12 % plot the sinusoid i3 plot (t.y) 14 xlabel ('time (s)' is ylabel ('amplitude Using the parameters provided in the sample code, complete the following exercises. 1. (R1.1) Plot a cosine having (1) half the frequency, (2) double the amplitude, (3) zero phase offset, and 2. (R1.2) Compute the phase in radians that will result in a phase delay of 0.3/ seconds compared to 3. Create a sine and cosine, each having a frequency of 5 Hz and no phase shift or DC offset. (R1.4) (4) a DC offset of -1 amplitude units. Also plot the original sinusoid on the same figure for reference. the original cosine. (R1.3) Plot the result including the original cosine on the same figure. Compute the amplitude of each sinusoid such that, when added together, the resulting waveform has an amplitude of 3 units and a phase delay of /4 radians. (R1.5) Adjust the tirne duration to display 5 full cycles and plot all three signals in the same figure, clearly labeled. 4. Write a Matlab script using a for loop that will gencrate a sum of N harmonically-related sinusoids in cosine form, each with a configurable amplitude and phase. 5. Use the script above and the parameters given below to generate a sum of harmonic sinusoids in cosine form. (R1.6) Include the modified script frequency-3 Hz duration = 2 seconds 1/2 1/3 /A 6. (R1.7) Using subplots with 5 rows and 2 columns, in the left-hand column plot each individual sinusoid with n increasing from top to bottom. In the right-coln, plot the cumulative sum of the sinusoids with each increasing n from top to bottom
Step by Step Solution
There are 3 Steps involved in it

Get step-by-step solutions from verified subject matter experts