Question: MATLAB HELP. NEED IT FAST Problem 3) Matlab function polar can be used to plot data in polar coordinates instead of rectangular coordinates. The general


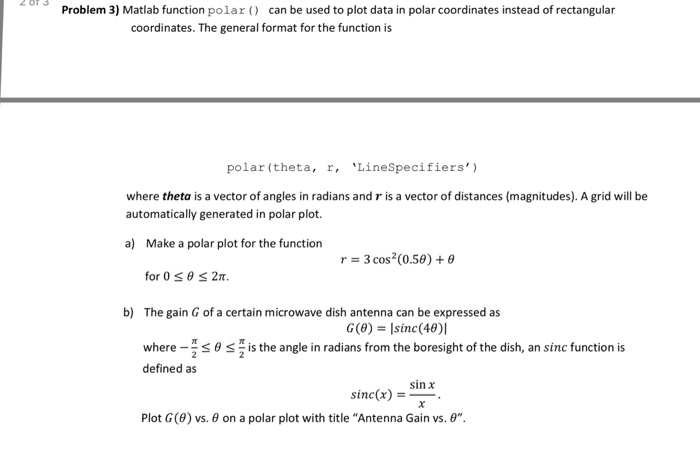
Problem 3) Matlab function polar can be used to plot data in polar coordinates instead of rectangular coordinates. The general format for the function is polar (theta r, Linespecifiers') where theta is a vector of angles in radians and r is a vector of distances (magnitudes). A grid will be automatically generated in polar plot. a) Make a polar plot for the function r cos (0.50) 0 for 0 s 0 s 2m. b) The gain G of a certain microwave dish antenna can be expressed as G(0) sinc(40)I where S 0 S is the angle in radians from the boresight of the dish, an sinc function is defined as sinx sinc(x) Plot G (0) vs. 0 on a polar plot with title "Antenna Gain vs. 0
Step by Step Solution
There are 3 Steps involved in it

Get step-by-step solutions from verified subject matter experts


