Answered step by step
Verified Expert Solution
Link Copied!

Question

1 Approved Answer

MATLAB Programming 2. Write a script that will read x and y data points from a file, and will create an area plot with these

MATLAB Programming
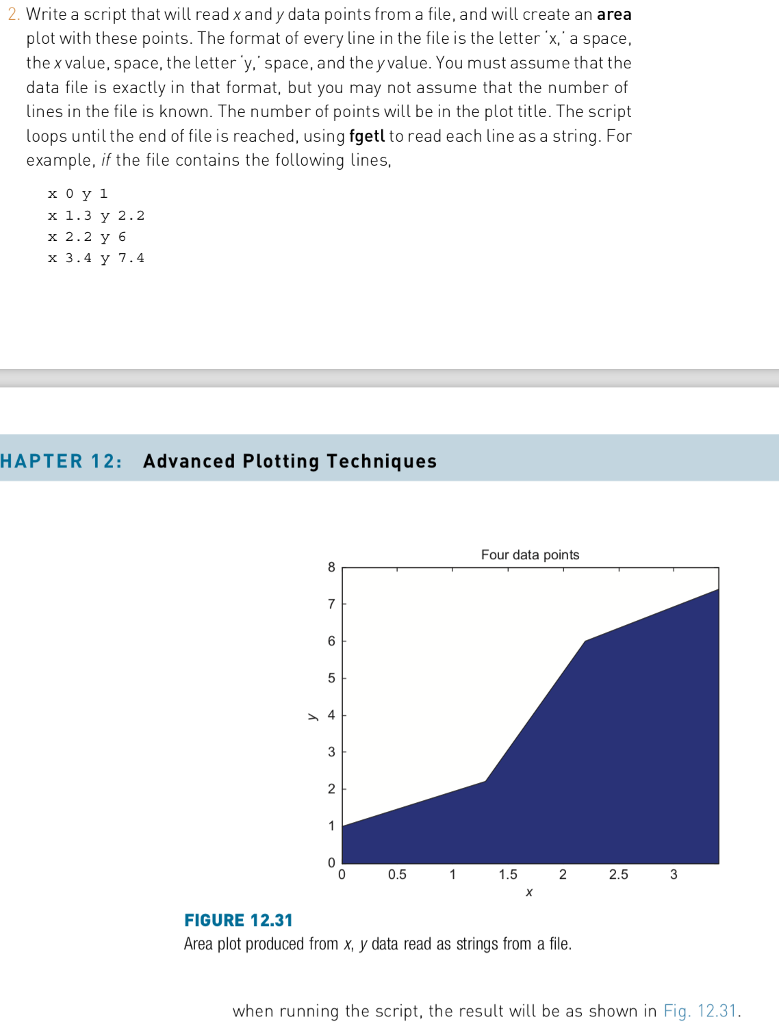
image text in transcribed

2. Write a script that will read x and y data points from a file, and will create an area plot with these points. The format of every line in the file is the letter'x, a space, the xvalue, space, the letter 'y, space, and the yvalue. You must assume that the data file is exactly in that format, but you may not assume that the number of lines in the file is known. The number of points will be in the plot title. The script loops until the end of file is reached, using fgetl to read each line as a string. For example, if the file contains the following lines x 1.3 y 2.2 x 2.2 y 6 x 3.4 y 7.4 HAPTER 12: Advanced Plotting Techniques Four data points 8 6 3 0.5 1.5 2.5 FIGURE 12.31 Area plot produced from x, y data read as strings from a file when running the script, the result will be as shown in Fig. 12.31

Step by Step Solution

There are 3 Steps involved in it

Step: 1

blur-text-image

Get Instant Access to Expert-Tailored Solutions

See step-by-step solutions with expert insights and AI powered tools for academic success

Step: 2

blur-text-image_2

Step: 3

blur-text-image_3

Ace Your Homework with AI

Get the answers you need in no time with our AI-driven, step-by-step assistance

Get Started

Recommended Textbook for

Databases In Networked Information Systems 6th International Workshop Dnis 2010 Aizu Wakamatsu Japan March 2010 Proceedings Lncs 5999

Authors: Shinji Kikuchi ,Shelly Sachdeva ,Subhash Bhalla

2010th Edition

3642120377, 978-3642120374

More Books

Students also viewed these Databases questions

Question

Discuss the challenges in scanning the environment.

Answered: 1 week ago

Question

=+ Are they breakable for any reason?

Answered: 1 week ago