Answered step by step
Verified Expert Solution
Link Copied!

Question

1 Approved Answer

Mohamed collected the monthly price of S&P 500 and Apple stock price for the past 5 year. He runs the regression and got the follow
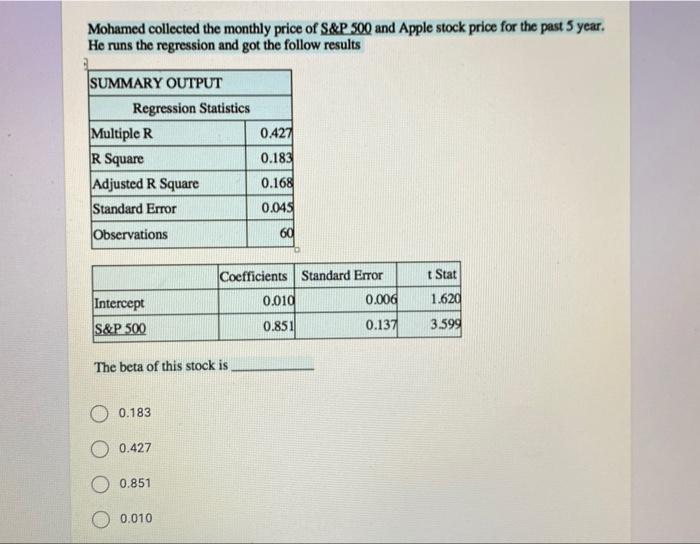
image text in transcribed
Mohamed collected the monthly price of S&P 500 and Apple stock price for the past 5 year. He runs the regression and got the follow results 0.427 SUMMARY OUTPUT Regression Statistics Multiple R R Square Adjusted R Square Standard Error Observations 0.183 0.168 0.045 60 t Stat Coefficients Standard Error 0.010 0.006 1.620 Intercept S&P 500 0.851 0.137 3.599 The beta of this stock is 0.183 O 0.427 0.851 0.010

Step by Step Solution

There are 3 Steps involved in it

Step: 1

blur-text-image

Get Instant Access to Expert-Tailored Solutions

See step-by-step solutions with expert insights and AI powered tools for academic success

Step: 2

blur-text-image

Step: 3

blur-text-image

Ace Your Homework with AI

Get the answers you need in no time with our AI-driven, step-by-step assistance

Get Started

Recommended Textbook for

Quantitative Analysis for Management

Authors: Barry Render, Ralph M. Stair, Michael E. Hanna, Trevor S. Ha

12th edition

133507335, 978-0133507331

More Books

Students also viewed these Finance questions