

Question
mport java.util.*; import java.awt.*; import java.awt.event.*; import java.awt.image.*; import java.awt.geom.*; import java.io.*; import javax.imageio.*; // Main class public class ImageHistogram extends Frame implements ActionListener {
mport java.util.*;
import java.awt.*;
import java.awt.event.*;
import java.awt.image.*;
import java.awt.geom.*;
import java.io.*;
import javax.imageio.*;
// Main class
public class ImageHistogram extends Frame implements ActionListener {
BufferedImage input;
int width, height;
TextField texRad, texThres;
ImageCanvas source, target;
PlotCanvas plot;
// Constructor
public ImageHistogram(String name) {
super("Image Histogram");
// load image
try {
input =
ImageIO.read(newFile(name));
}
catch ( Exception ex ) {
ex.printStackTrace();
}
width = input.getWidth();
height = input.getHeight();
// prepare the panel for image canvas.
Panel main = new Panel();
source = new ImageCanvas(input);
plot = new PlotCanvas();
target = new ImageCanvas(input);
main.setLayout(new GridLayout(1, 3, 10, 10));
main.add(source);
main.add(plot);
main.add(target);
// prepare the panel for buttons.
Panel controls = new Panel();
Button button = new Button("Display Histogram");
button.addActionListener(this);
controls.add(button);
button = new Button("Histogram Stretch");
button.addActionListener(this);
controls.add(button);
controls.add(new Label("Cutoff fraction:"));
texThres = new TextField("10", 2);
controls.add(texThres);
button = new Button("Aggressive Stretch");
button.addActionListener(this);
controls.add(button);
button = new Button("Histogram Equalization");
button.addActionListener(this);
controls.add(button);
// add two panels
add("Center", main);
add("South", controls);
addWindowListener(new ExitListener());
setSize(width*2+400, height+100);
setVisible(true);
}
class ExitListener extends WindowAdapter {
public void windowClosing(WindowEvent e) {
System.exit(0);
}
}
// Action listener for button click events
public void actionPerformed(ActionEvent e) {
//compute the average color for the image
if ( ((Button)e.getSource()).getLabel().equals("Display Histogram") ) {
float red=0, green=0, blue=0;
for ( int y=0, i=0 ; y for ( int x=0 ; x Color clr = new Color(input.getRGB(x, y)); red += clr.getRed(); green += clr.getGreen(); blue += clr.getBlue(); } red /= width * height; green /= width * height; blue /= width * height; plot.setMeanColor(new Color((int)red,(int)green,(int)blue)); } } public static void main(String[] args) { new ImageHistogram(args.length==1 ? args[0] : "baboo.png"); } } // Canvas for plotting histogram class PlotCanvas extends Canvas { // lines for plotting axes and mean color locations LineSegment x_axis, y_axis; LineSegment red, green, blue; boolean showMean = false; public PlotCanvas() { x_axis = new LineSegment(Color.BLACK, -10, 0, 256+10, 0); y_axis = new LineSegment(Color.BLACK, 0, -10, 0, 200+10); } // set mean image color for plot public void setMeanColor(Color clr) { red = new LineSegment(Color.RED, clr.getRed(), 0, clr.getRed(), 100); green = new LineSegment(Color.GREEN, clr.getGreen(), 0, clr.getGreen(), 100); blue = new LineSegment(Color.BLUE, clr.getBlue(), 0, clr.getBlue(), 100); showMean = true; repaint(); } // redraw the canvas public void paint(Graphics g) { // draw axis int xoffset = (getWidth() - 256) / 2; int yoffset = (getHeight() - 200) / 2; x_axis.draw(g, xoffset, yoffset, getHeight()); y_axis.draw(g, xoffset, yoffset, getHeight()); if ( showMean ) { red.draw(g, xoffset, yoffset, getHeight()); green.draw(g, xoffset, yoffset, getHeight()); blue.draw(g, xoffset, yoffset, getHeight()); } } } // LineSegment class defines line segments to be plotted class LineSegment { // location and color of the line segment int x0, y0, x1, y1; Color color; // Constructor public LineSegment(Color clr, int x0, int y0, int x1, int y1) { color = clr; this.x0 = x0; this.x1 = x1; this.y0 = y0; this.y1 = y1; } public void draw(Graphics g, int xoffset, int yoffset, int height) { g.setColor(color); g.drawLine(x0+xoffset, height-y0-yoffset, x1+xoffset, height-y1-yoffset); } } Also given the ImageCanvas.java: import java.awt.*; import java.awt.event.*; import java.awt.image.*; import java.io.*; import javax.imageio.*; // Canvas for image display class ImageCanvas extends Canvas { BufferedImage image; // initialize the image and mouse control public ImageCanvas(BufferedImage input) { image = input; addMouseListener(new ClickListener()); } // redraw the canvas public void paint(Graphics g) { // draw boundary g.setColor(Color.gray); g.drawRect(0, 0, getWidth()-1, getHeight()-1); // compute the offset of the image. int xoffset = (getWidth() - image.getWidth()) / 2; int yoffset = (getHeight() - image.getHeight()) / 2; g.drawImage(image, xoffset, yoffset, this); } // change the image and redraw the canvas public void resetImage(Image input) { image = new BufferedImage(input.getWidth(null), input.getHeight(null), BufferedImage.TYPE_INT_RGB); Graphics2D g2D = image.createGraphics(); g2D.drawImage(input, 0, 0, null); repaint(); } // listen to mouse click class ClickListener extends MouseAdapter { public void mouseClicked(MouseEvent e) { if ( e.getClickCount() == 2 && e.getButton() == MouseEvent.BUTTON3 ) try { ImageIO.write(image, "png", new File("saved.png")); } catch ( Exception ex ) { ex.printStackTrace(); } } } } The output when ran is: Create the code for each of the histogram stretch, aggressive stretch and histogram equalization buttons so when pressed the program applies each function to the image and displays the corresponding histogram. Can work for any image.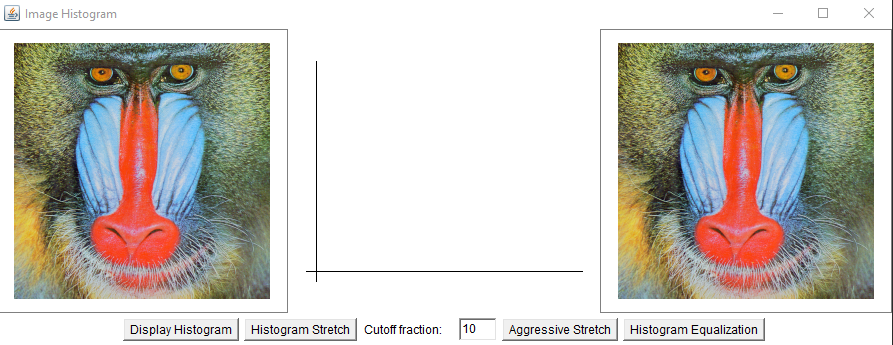
Step by Step Solution
There are 3 Steps involved in it
Step: 1

Get Instant Access to Expert-Tailored Solutions
See step-by-step solutions with expert insights and AI powered tools for academic success
Step: 2

Step: 3
Ace Your Homework with AI
Get the answers you need in no time with our AI-driven, step-by-step assistance
Get Started
Introduction To Constraint Databases
Authors: Peter Revesz
1st Edition
1441931554, 978-1441931559