Answered step by step
Verified Expert Solution
Question
1 Approved Answer
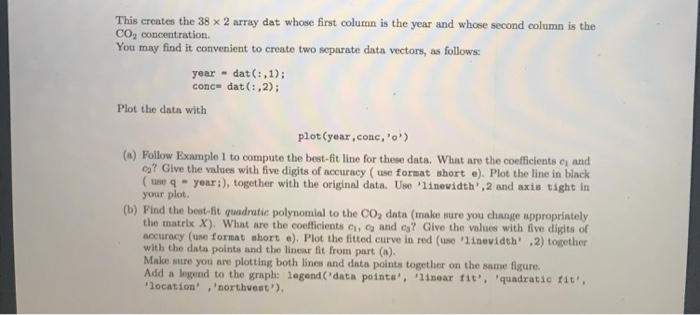
***must do in MATLAB*** 1. Download the file gco2.dat from the web page. This file contains two columns of numbers: the year from 1980 to
***must do in MATLAB*** 


1. Download the file gco2.dat from the web page. This file contains two columns of numbers: the year from 1980 to 2017 and the average global annual carbon dioxide concentration in the atmosphere (in parts per million) over marine surface sites. The data come from the Earth Systems Research Laboratory (Global Monitoring Division) of the National Occanic and Atmospheric Administration (which is the government agency charged with developing weather and climate forecast models; if you are interested in additional information and data set you can visit http://www.esrl.noaa. gov/gmd/ccgg/trends). The estimated standard error in the observations is 0.1 ppm. Save the file in the MATLAB working directory. Then load it with dat load C'gco2.dat Note: if you do not save the file in your working directory, you need to include the whole path to lond it lnth MATLAtrce u saved your fle n the C:ltap directory you can load i by entering load ('C:\templgco2.dat) 


Step by Step Solution
There are 3 Steps involved in it
Step: 1

Get Instant Access to Expert-Tailored Solutions
See step-by-step solutions with expert insights and AI powered tools for academic success
Step: 2

Step: 3

Ace Your Homework with AI
Get the answers you need in no time with our AI-driven, step-by-step assistance
Get Started


