

Answered step by step
Verified Expert Solution
Question
1 Approved Answer
Must reach at least $65 million in sales. Must create a new product. Must reach at least a cumulative profit of $1 million. Must reach
Must reach at least $65 million in sales.
Must create a new product.
Must reach at least a cumulative profit of $1 million.
Must reach at least a 35% contribution margin.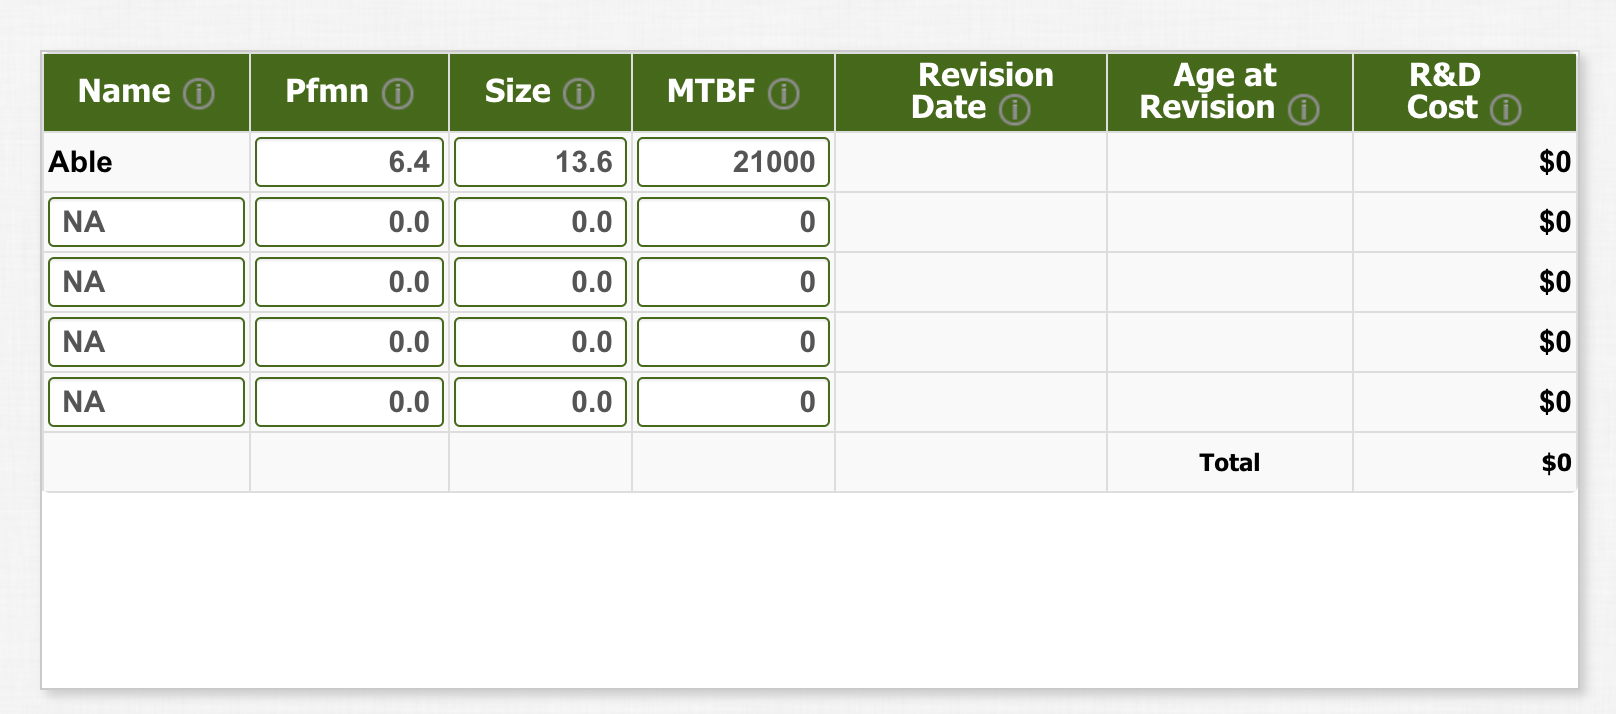
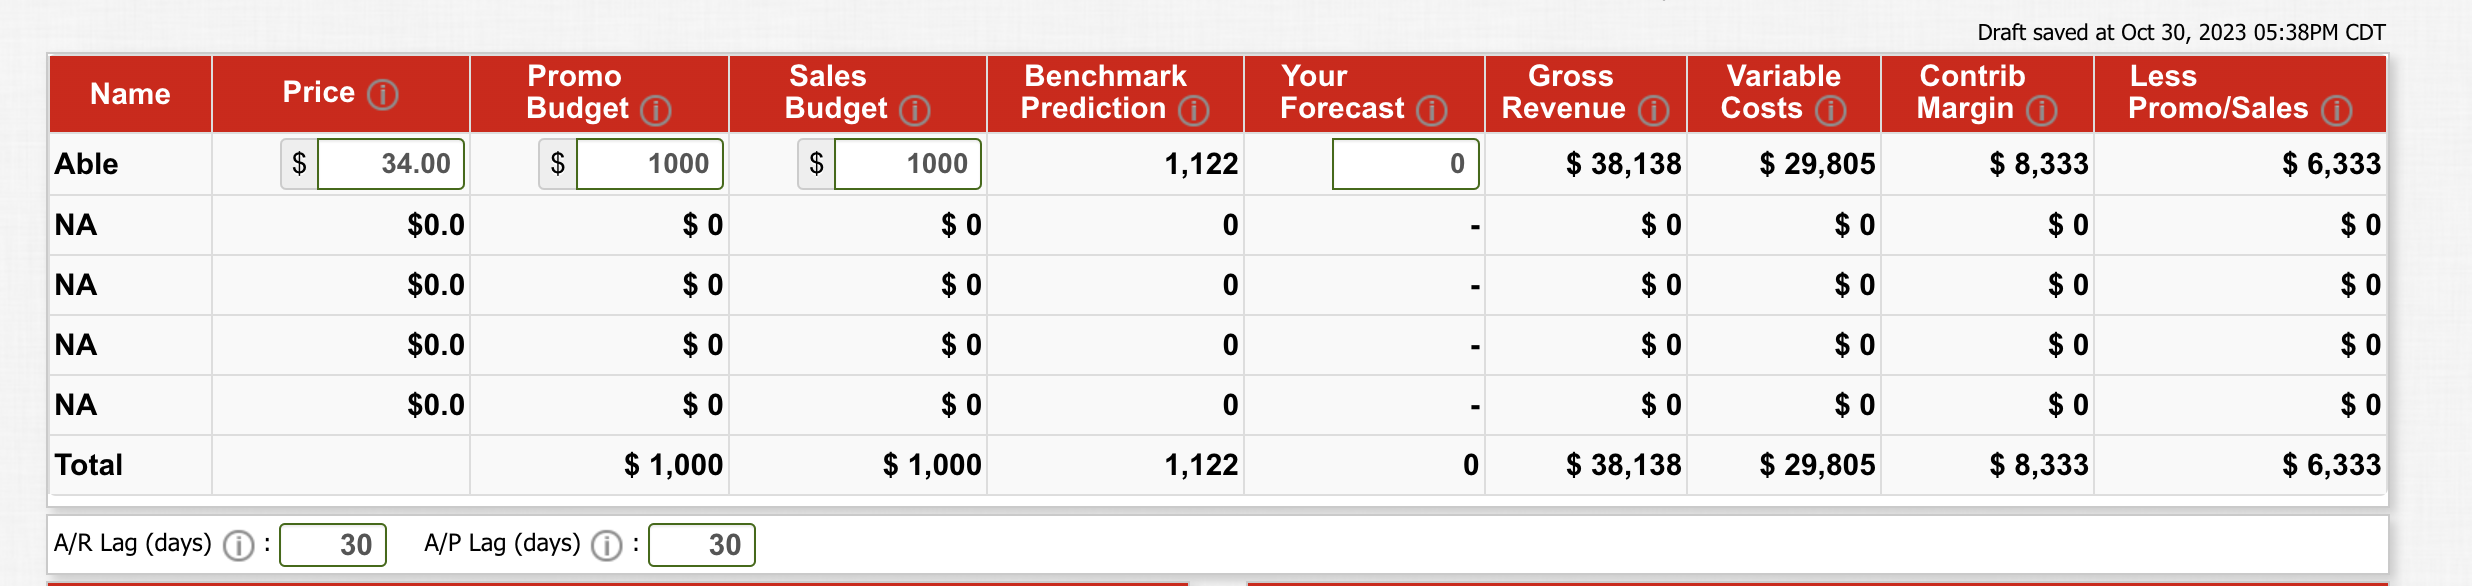
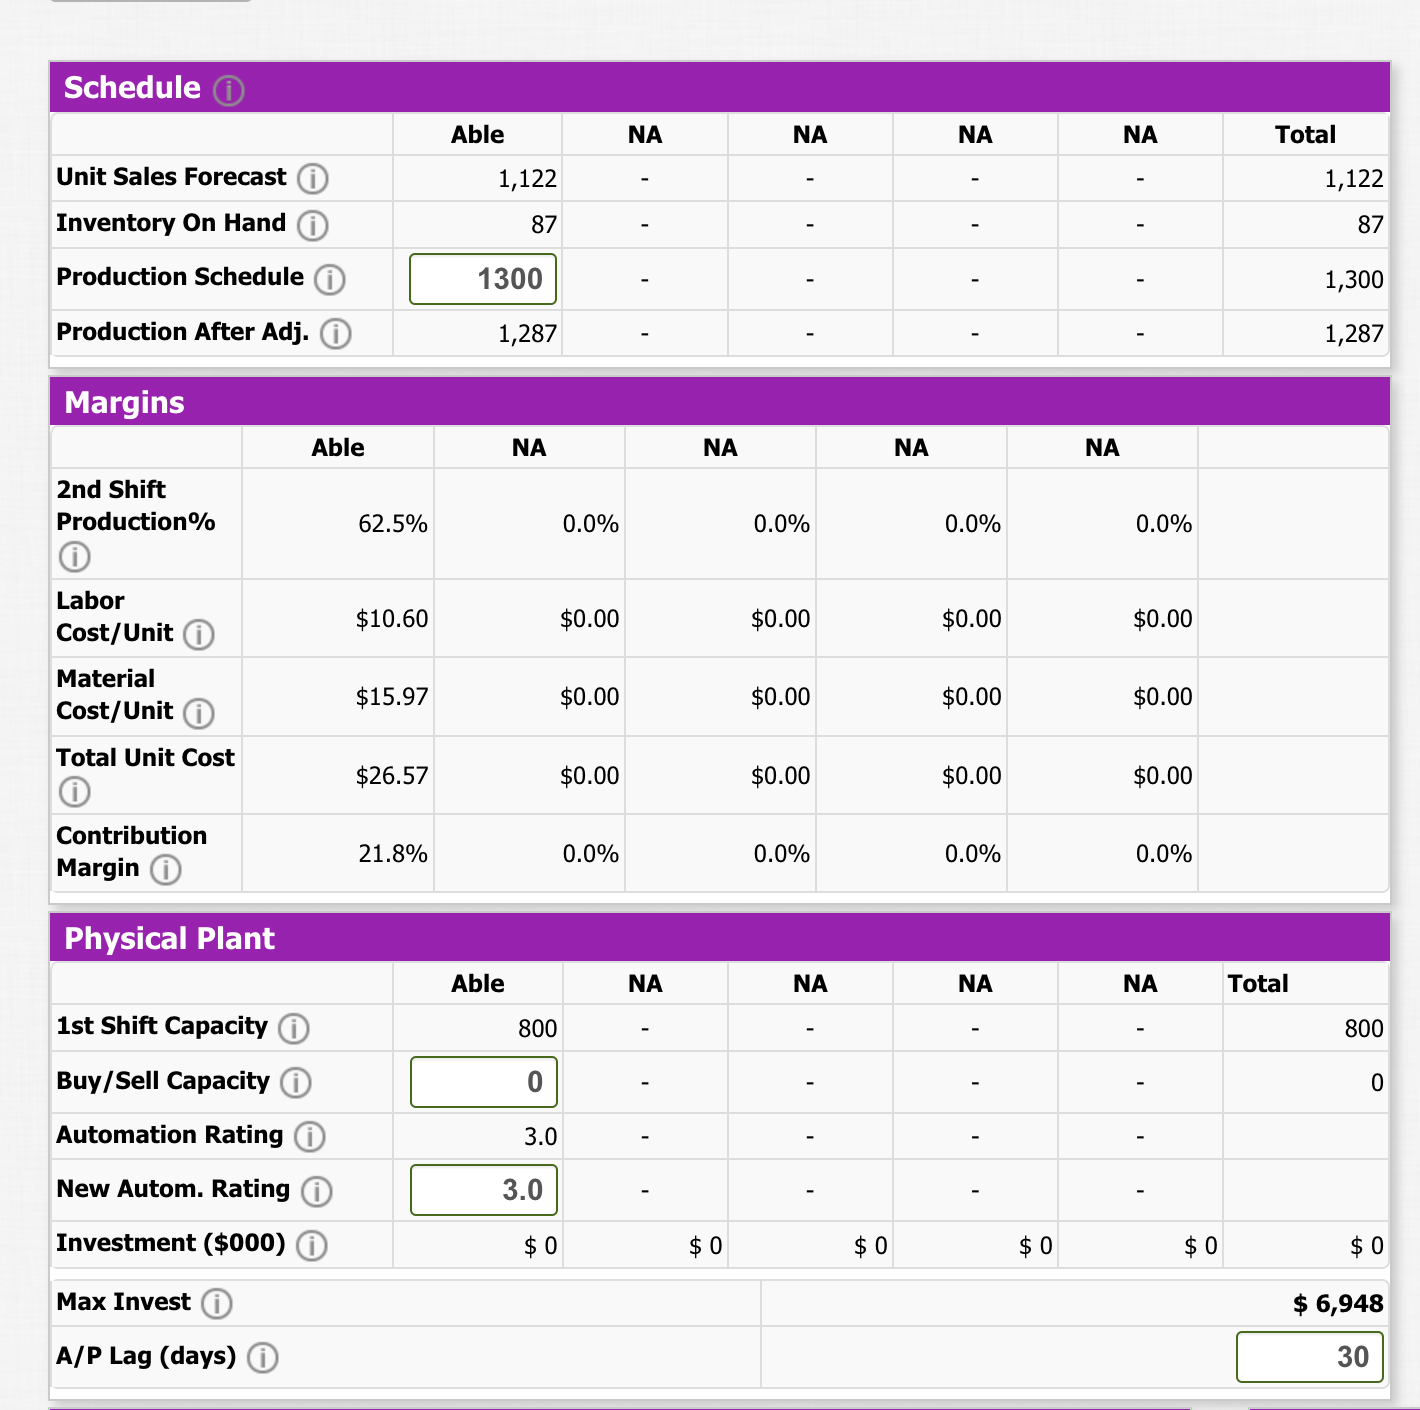
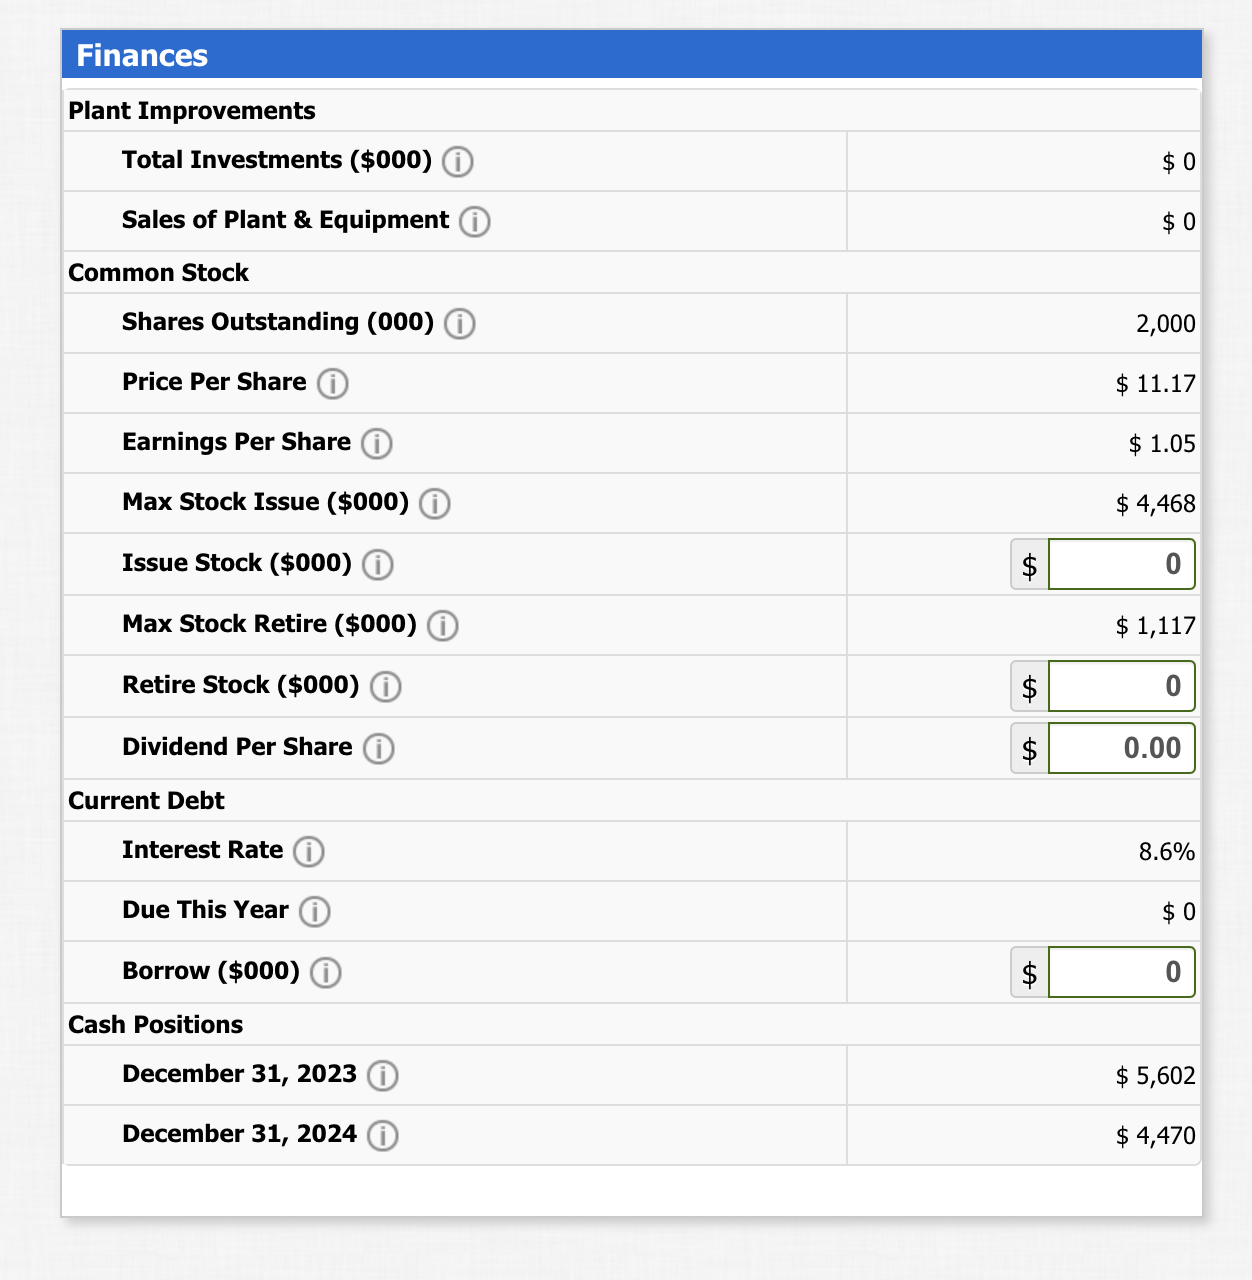 Schedule \begin{tabular}{|c|c|c|c|c|c|c|} \hline & Able & NA & NA & NA & NA & Total \\ \hline Unit Sales Forecast (i) & 1,122 & - & - & - & - & 1,122 \\ \hline Inventory On Hand (i) & 87 & - & - & - & - & 87 \\ \hline Production Schedule (i) & 1300 & - & - & - & - & 1,300 \\ \hline Production After Adj. (i) & 1,287 & - & - & - & - & 1,287 \\ \hline \end{tabular} \begin{tabular}{|l|r|r|r|r|r|} \hline Margins & \multicolumn{1}{|c|}{ Able } & NA & NA & NA & NA \\ \hline \begin{tabular}{l} 2nd Shift \\ Production \% \\ (i) \end{tabular} & 62.5% & 0.0% & 0.0% & 0.0% & 0.0% \\ \hline \begin{tabular}{l} Labor \\ Cost/Unit (i) \end{tabular} & $10.60 & $0.00 & $0.00 & $0.00 & $0.00 \\ \hline \begin{tabular}{l} Material \\ Cost/Unit (i) \end{tabular} & $15.97 & $0.00 & $0.00 & $0.00 & $0.00 \\ \hline \begin{tabular}{l} Total Unit Cost \\ (i) \end{tabular} & $26.57 & $0.00 & $0.00 & $0.00 & $0.00 \\ \hline \begin{tabular}{l} Contribution \\ Margin (i) \end{tabular} & 21.8% & 0.0% & 0.0% & 0.0% & 0.0% \\ \hline \end{tabular} \begin{tabular}{|c|c|c|c|c|c|c|} \hline & Able & NA & NA & NA & NA & Total \\ \hline 1st Shift Capacity (i) & 800 & - & - & - & - & 800 \\ \hline Buy/Sell Capacity (i) & 0 & - & - & - & - & 0 \\ \hline Automation Rating (i) & 3.0 & - & - & - & - & \\ \hline New Autom. Rating (i) & 3.0 & - & - & - & - & \\ \hline Investment (\$000) (i) & $0 & $0 & $0 & $0 & $0 & $0 \\ \hline \multicolumn{3}{|l|}{ Max Invest (i) } & \multicolumn{4}{|r|}{$6,948} \\ \hline \multicolumn{3}{|l|}{ A/P Lag (days) (i) } & & & & 30 \\ \hline \end{tabular} \begin{tabular}{|c|c|c|c|c|c|c|} \hline Name (i) & Pfmn (i) & Size (i) & MTBF (i) & \begin{tabular}{l} Revision \\ Date (i) \end{tabular} & \begin{tabular}{c} Age at \\ Revision (i) \end{tabular} & \begin{tabular}{l} R\&D \\ Cost (i) \end{tabular} \\ \hline Able & 6.4 & 13.6 & 21000 & & & $0 \\ \hline NA & 0.0 & 0.0 & 0 & & & $0 \\ \hline NA & 0.0 & 0.0 & 0 & & & $0 \\ \hline NA & 0.0 & 0.0 & 0 & & & $0 \\ \hline \multirow[t]{2}{*}{ NA } & 0.0 & 0.0 & 0 & & & $0 \\ \hline & & & & & Total & $0 \\ \hline \end{tabular} \begin{tabular}{|c|c|c|c|c|c|c|c|c|c|c|c|c|} \hline Name & \multicolumn{2}{|c|}{ Price (i) } & \multicolumn{2}{|c|}{\begin{tabular}{l} Promo \\ Budget (i) \end{tabular}} & \multicolumn{2}{|c|}{\begin{tabular}{l} Sales \\ Budget (i) \end{tabular}} & \multirow{2}{*}{\begin{tabular}{r|} Benchmark \\ Prediction (i) \\ 1,122 \end{tabular}} & \begin{tabular}{l} Your \\ Forecast (i) \end{tabular} & \multirow{2}{*}{\begin{tabular}{|r|} \begin{tabular}{c} Gross \\ Revenue (i) \end{tabular} \\ $38,138 \end{tabular}} & \multirow{2}{*}{\begin{tabular}{|c|} \begin{tabular}{l} Variable \\ Costs (i) \end{tabular} \\ $29,805 \end{tabular}} & \multirow{2}{*}{\begin{tabular}{r} Contrib \\ Margin (i) \\ $8,333 \end{tabular}} & \multirow{2}{*}{\begin{tabular}{l} Less \\ Promo/Sales (i) \\ $6,333 \end{tabular}} \\ \hline Able & $ & 34.00 & $ & 1000 & $ & 1000 & & 0 & & & & \\ \hline NA & & $0.0 & & $0 & & $0 & 0 & - & $0 & $0 & $0 & $0 \\ \hline NA & & $0.0 & & $0 & & $0 & 0 & - & $0 & $0 & $0 & $0 \\ \hline NA & & $0.0 & & $0 & & $0 & 0 & - & $0 & $0 & $0 & $0 \\ \hline NA & & $0.0 & & $0 & & $0 & 0 & - & $0 & $0 & $0 & $0 \\ \hline Total & & & & $1,000 & & $1,000 & 1,122 & 0 & $38,138 & $29,805 & $8,333 & $6,333 \\ \hline A/R Lag (days & & A/P & (days) & 30 & & & & & & & & \\ \hline \end{tabular} Finances \begin{tabular}{|c|c|c|} \hline \multicolumn{3}{|l|}{ Plant Improvements } \\ \hline Total Investments (\$000) (i) & & $0 \\ \hline Sales of Plant \& Equipment (i) & & $0 \\ \hline \multicolumn{3}{|l|}{ Common Stock } \\ \hline Shares Outstanding (000) (i) & & 2,000 \\ \hline Price Per Share (i) & & $11.17 \\ \hline Earnings Per Share (i) & & $1.05 \\ \hline Max Stock Issue (\$000) (i) & & $4,468 \\ \hline Issue Stock (\$000) (i) & $ & 0 \\ \hline Max Stock Retire (\$000) (i) & & $1,117 \\ \hline Retire Stock (\$000) (i) & $ & 0 \\ \hline Dividend Per Share (i) & $ & 0.00 \\ \hline \multicolumn{3}{|l|}{ Current Debt } \\ \hline Interest Rate (i) & & 8.6% \\ \hline Due This Year (i) & & $0 \\ \hline Borrow (\$000) (i) & $ & 0 \\ \hline \multicolumn{3}{|l|}{ Cash Positions } \\ \hline December 31, 2023 (i) & & $5,602 \\ \hline December 31, 2024 (i) & & $4,470 \\ \hline \end{tabular}
 Step by Step Solution
There are 3 Steps involved in it
Step: 1

Get Instant Access to Expert-Tailored Solutions
See step-by-step solutions with expert insights and AI powered tools for academic success
Step: 2

Step: 3
Ace Your Homework with AI
Get the answers you need in no time with our AI-driven, step-by-step assistance
Get Started
The FinTech Book The Financial Technology Handbook For Investors Entrepreneurs And Visionaries
Authors: Susanne Chishti, Janos Barberis
1st Edition
111921887X, 9781119218876