

Question
**Must use D3 library in JavaScript** Q2: Write a program that reads the data file msl.csv, normalizes the values between 0 and 1, and write
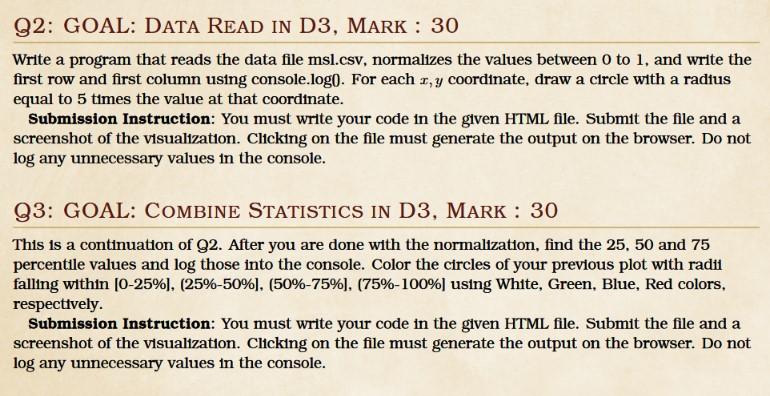
**Must use D3 library in JavaScript** Q2: Write a program that reads the data file msl.csv, normalizes the values between 0 and 1, and write the first row and first column using console.log(). For each x,y coordinate, draw a circle with a radius equal to 5 times the value at that coordinate.
Q3: Find the 25, 50, and 75 percentile values and log those into the console. Color the circles of your previous plot with radii falling within [0-25%], [25%-50%], [50%-75%], [75%-100%] using White, Green, Blue, Red colors, respectively.
Step by Step Solution
There are 3 Steps involved in it
Step: 1

Get Instant Access to Expert-Tailored Solutions
See step-by-step solutions with expert insights and AI powered tools for academic success
Step: 2

Step: 3
Ace Your Homework with AI
Get the answers you need in no time with our AI-driven, step-by-step assistance
Get Started
Database And Expert Systems Applications 22nd International Conference Dexa 2011 Toulouse France August/September 2011 Proceedings Part 1 Lncs 6860
Authors: Abdelkader Hameurlain ,Stephen W. Liddle ,Klaus-Dieter Schewe ,Xiaofang Zhou
2011th Edition
3642230873, 978-3642230875