

Question
Need help adjusting the following code to use a for loop to plot 21 of the graphs below gradually changing colors from blue to red
Need help adjusting the following code to use a for loop to plot 21 of the graphs below gradually changing colors from blue to red left to right.
The following code incorporates a built in function called logistic and the code is posted below. This is only one question. Thanks for the help!
function [f] = logistic(t,t0,L,k) % The logistic function logistic(t, t0, L, k) % t is time and t0 marks the midpoint % L is the limiting maximum value of the sigmoidal curve, % and k is the steepness. f = L ./ (1 + exp(-k*(t-t0))); end
**ACTUAL CODE**
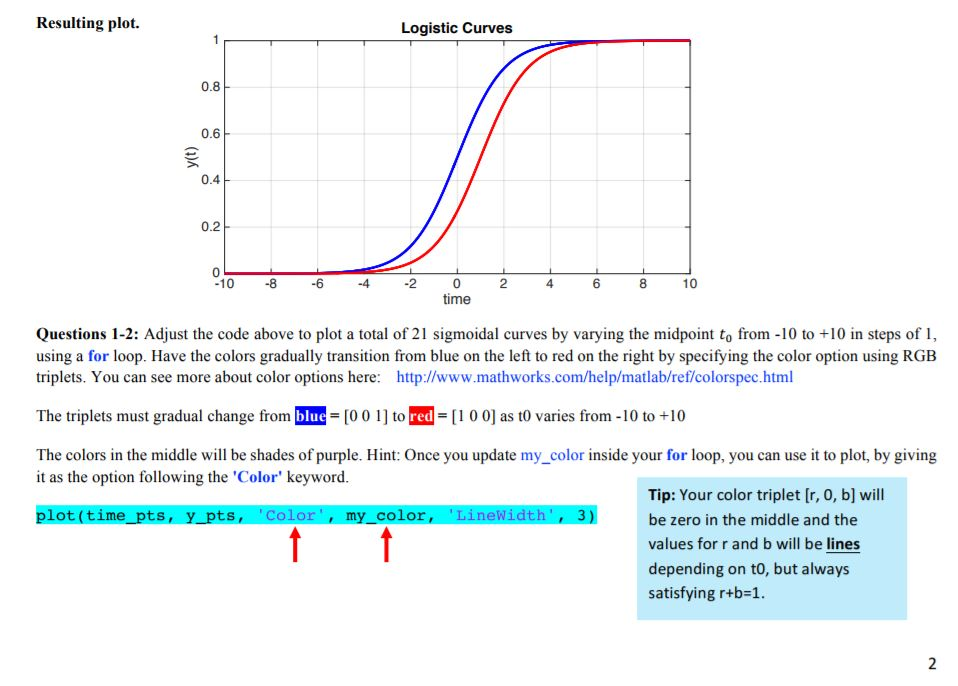
time_pts = -10 : 0.1 : 10; y_pts = logistic(time_pts, 0, 1, 1); plot(time_pts, y_pts, 'blue', 'LineWidth', 3) % The standard curve. grid on set(gca, 'FontSize', 20) title('Logistic Curves') xlabel('time'); ylabel('y(t)') hold on y_pts = logistic(time_pts, 1, 1, 1); % New sigmoid curve with midpoint at t = 1. plot(time_pts, y_pts, 'red', 'LineWidth', 3)
Resulting plot. Logistic Curves 0.8 0.6 0.4 0.2 -10-8 -6 4 8 time Questions 1-2: Adjust the code above to plot a total of 21 sigmoidal curves by varying the midpoint to from -10 to +10 in steps of 1, using a for loop. Have the colors gradually transition from blue on the left to red on the right by specifying the color option using RGB triplets. You can see more about color options here: http://www.mathworks.com/help/matlab/ref/colorspec.html The triplets must gradual change from -[ 0 0 1] -[ 1 0 as t0 varies from-10 to +10 The colors in the middle will be shades of purple. Hint: Once you update my_ color inside your for loop, you can use it to plot, by giving it as the option following the 'Color' keyword Tip: Your color triplet [r, 0, b] will be zero in the middle and the values for r and b will be lines depending on to, but always satisfying r+b-1 lot (time pts, y pts, my_ color, Resulting plot. Logistic Curves 0.8 0.6 0.4 0.2 -10-8 -6 4 8 time Questions 1-2: Adjust the code above to plot a total of 21 sigmoidal curves by varying the midpoint to from -10 to +10 in steps of 1, using a for loop. Have the colors gradually transition from blue on the left to red on the right by specifying the color option using RGB triplets. You can see more about color options here: http://www.mathworks.com/help/matlab/ref/colorspec.html The triplets must gradual change from -[ 0 0 1] -[ 1 0 as t0 varies from-10 to +10 The colors in the middle will be shades of purple. Hint: Once you update my_ color inside your for loop, you can use it to plot, by giving it as the option following the 'Color' keyword Tip: Your color triplet [r, 0, b] will be zero in the middle and the values for r and b will be lines depending on to, but always satisfying r+b-1 lot (time pts, y pts, my_ color
Step by Step Solution
There are 3 Steps involved in it
Step: 1

Get Instant Access to Expert-Tailored Solutions
See step-by-step solutions with expert insights and AI powered tools for academic success
Step: 2

Step: 3
Ace Your Homework with AI
Get the answers you need in no time with our AI-driven, step-by-step assistance
Get Started
Database Concepts
Authors: David Kroenke, David J. Auer
3rd Edition
0131986252, 978-0131986251