Question: Need help with screenshots 5 through 10. All information needed in solving these screenshots can be found below. Thanks. 5 The null and alternative hypotheses
Need help with screenshots 5 through 10. All information needed in solving these screenshots can be found below. Thanks.
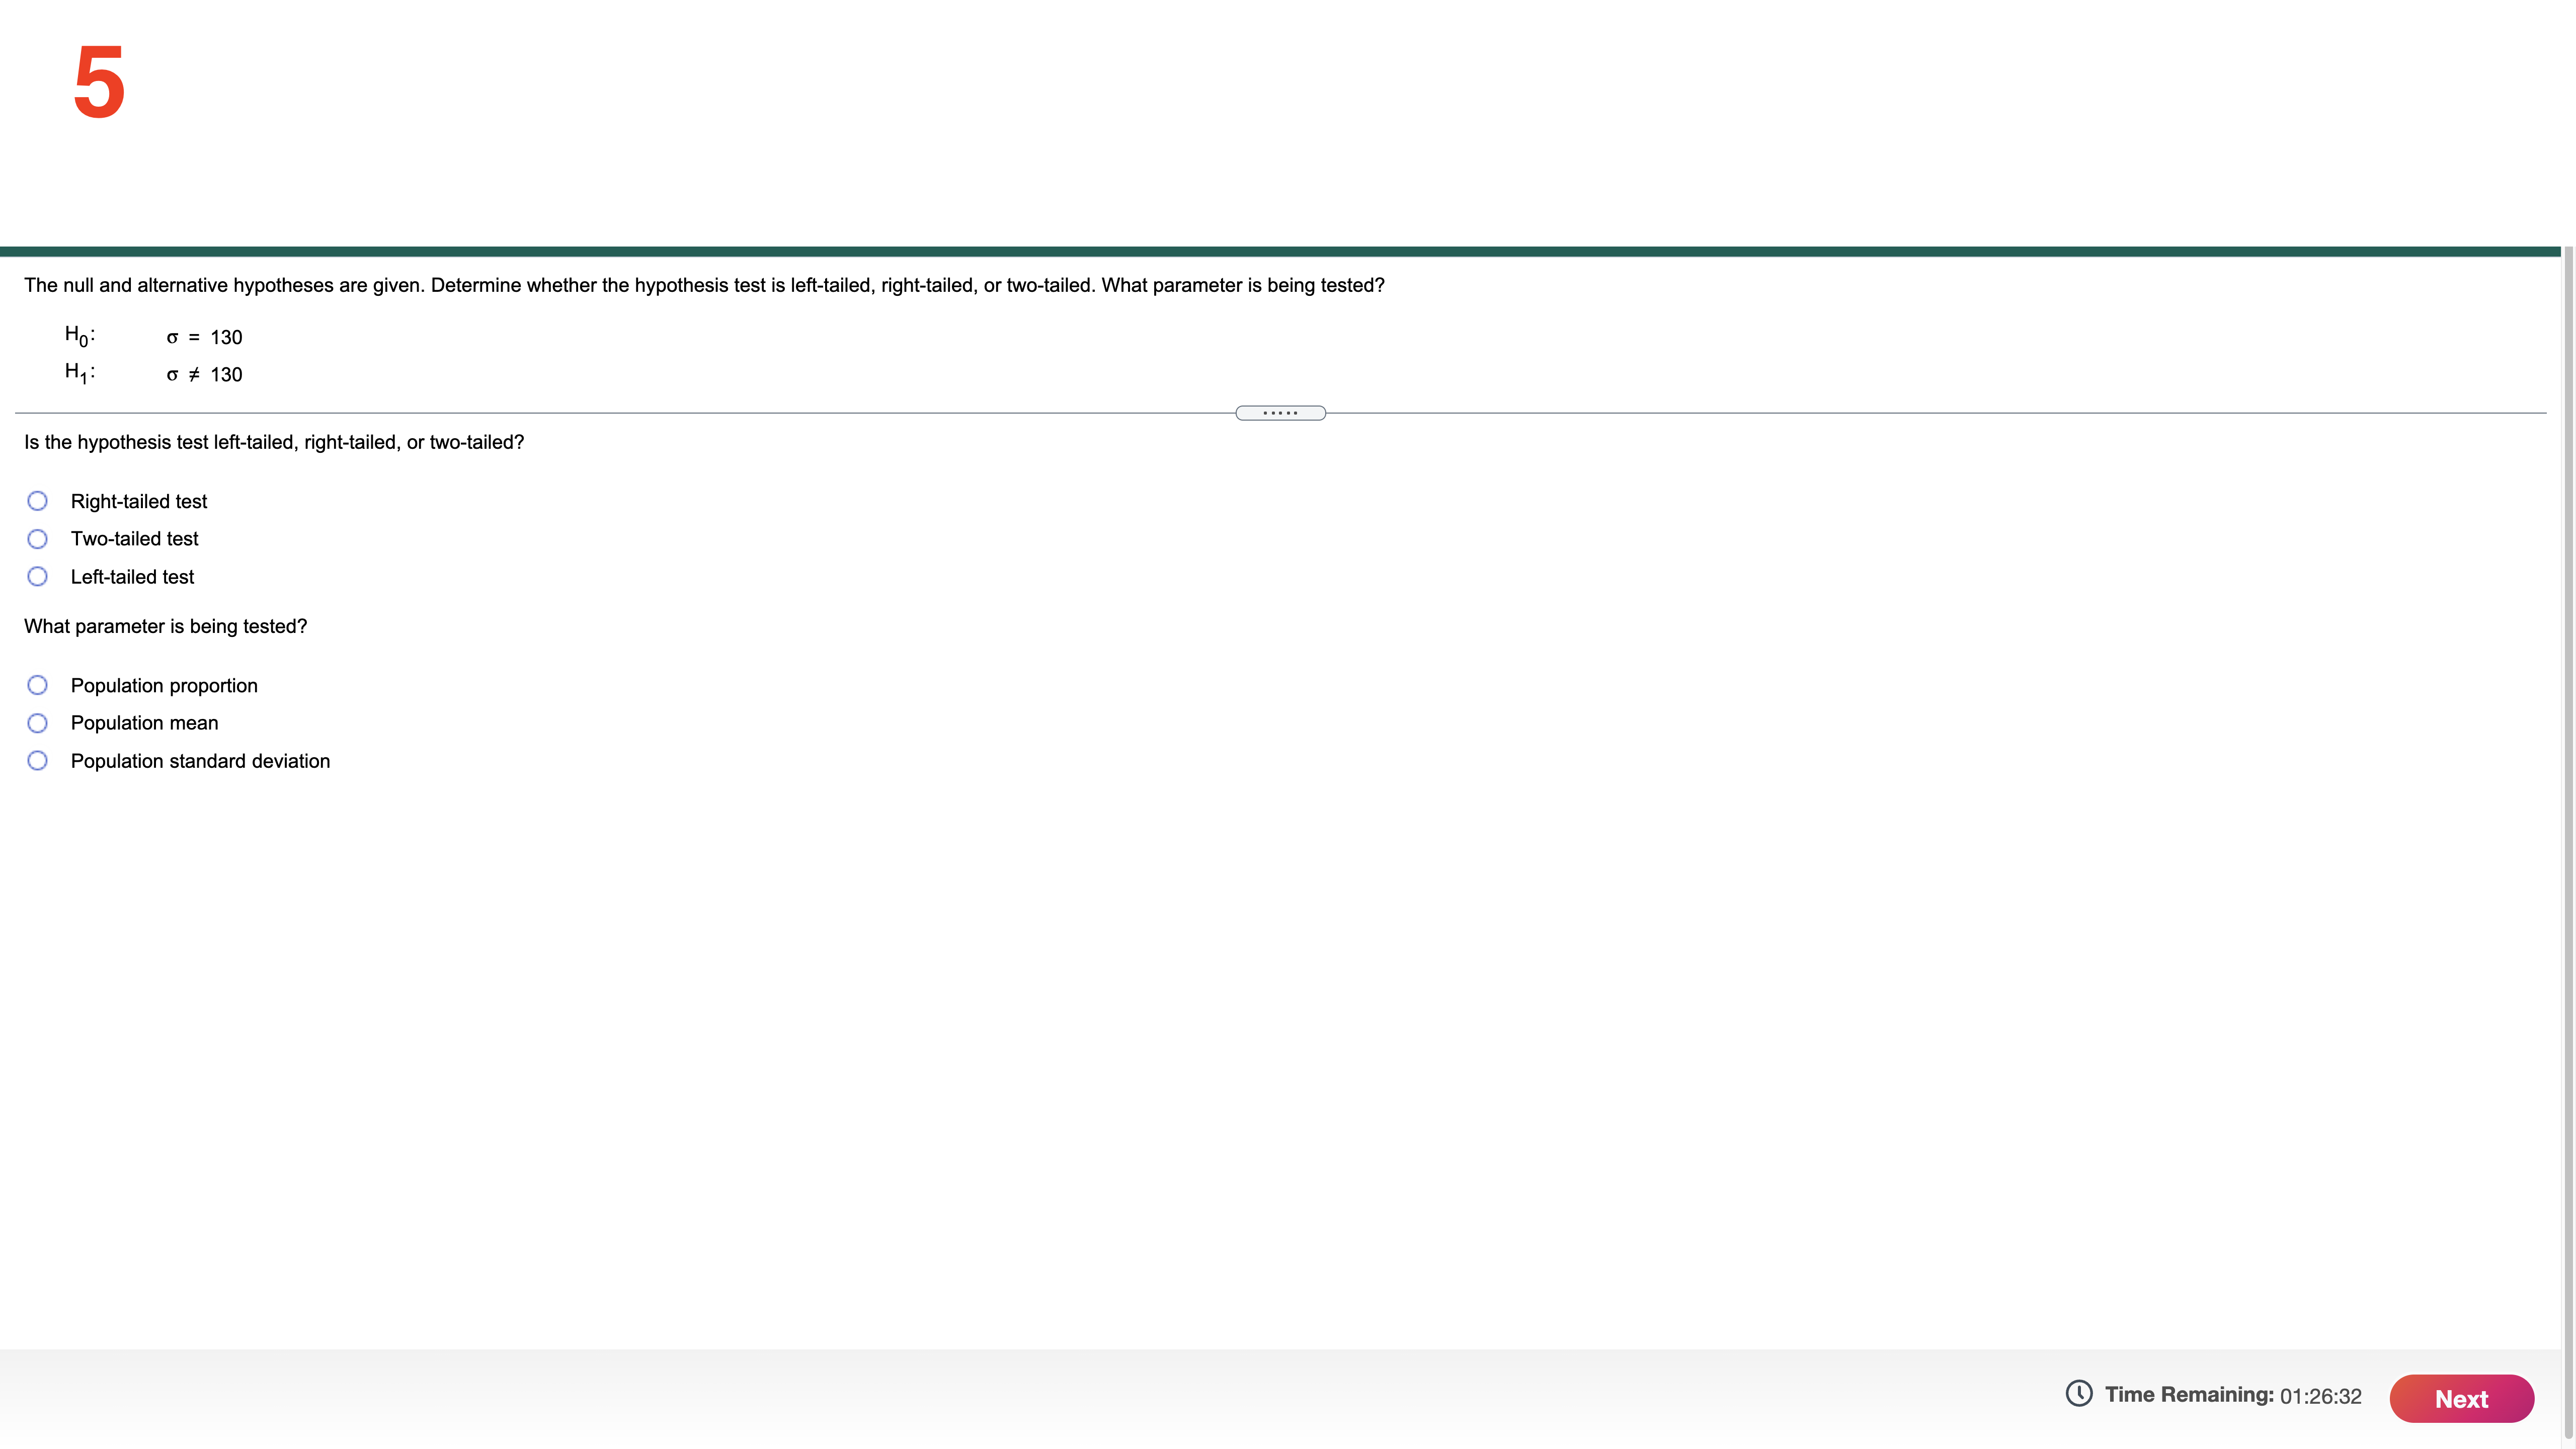
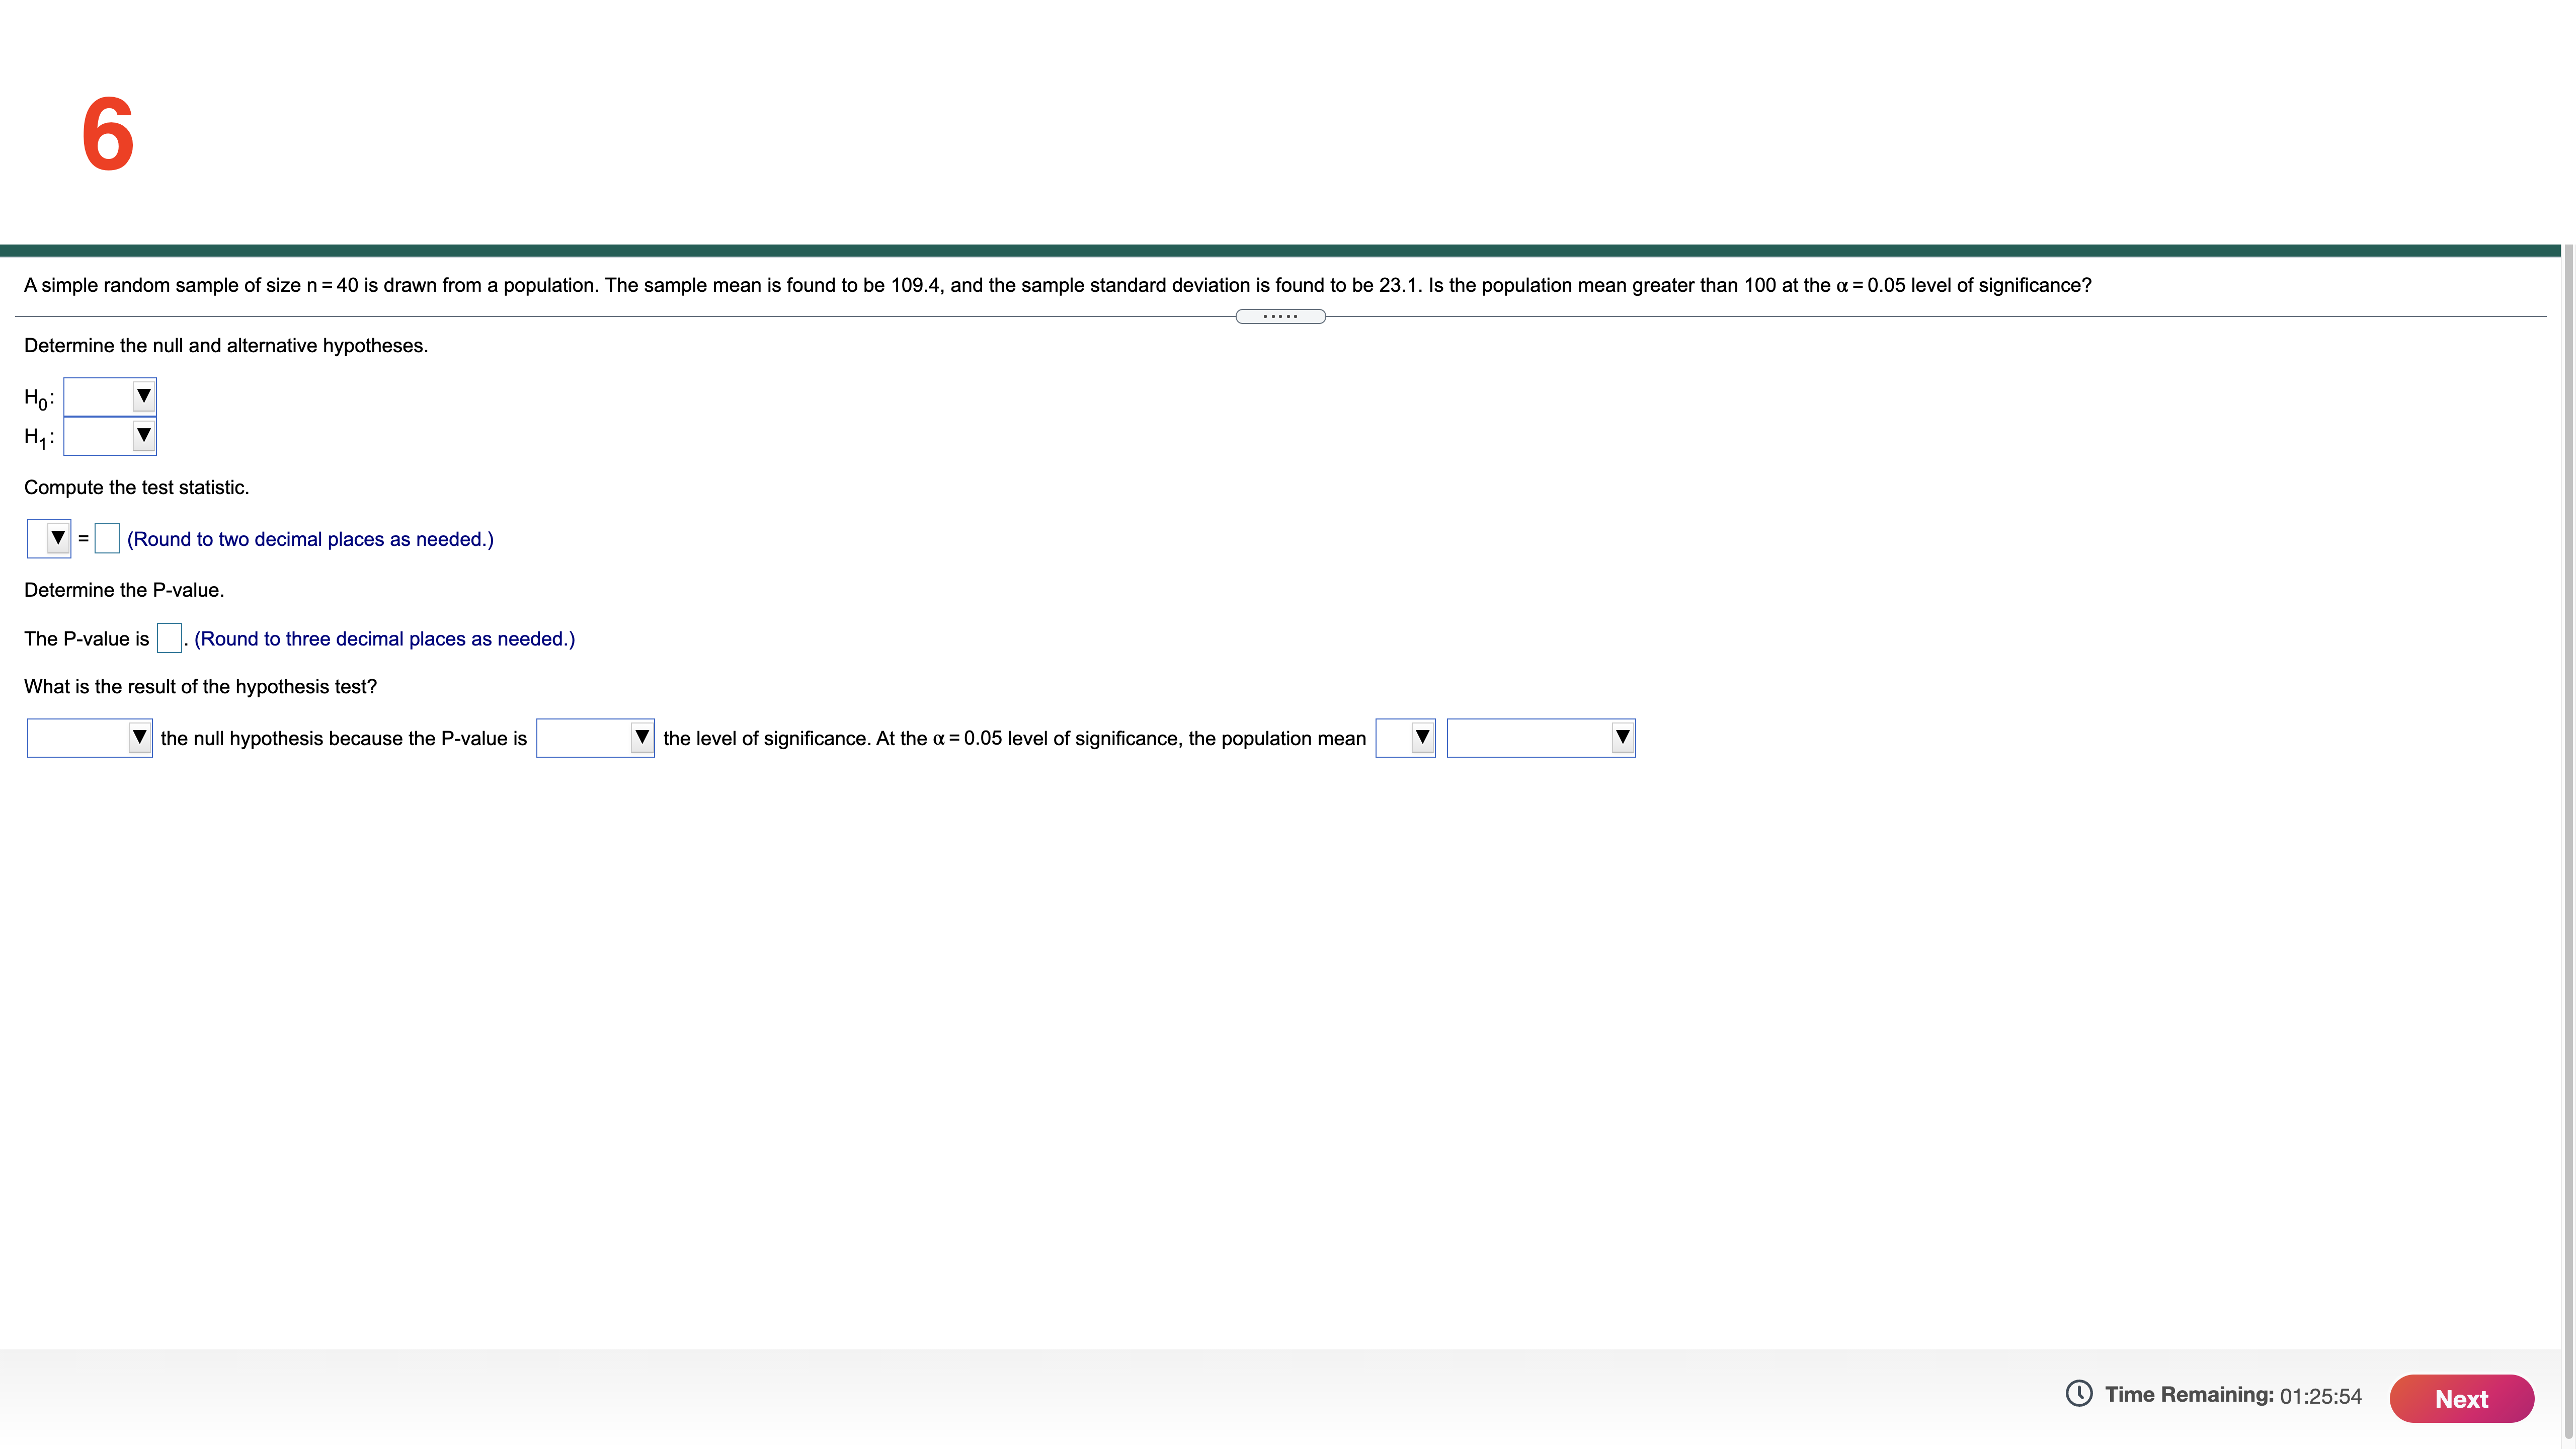
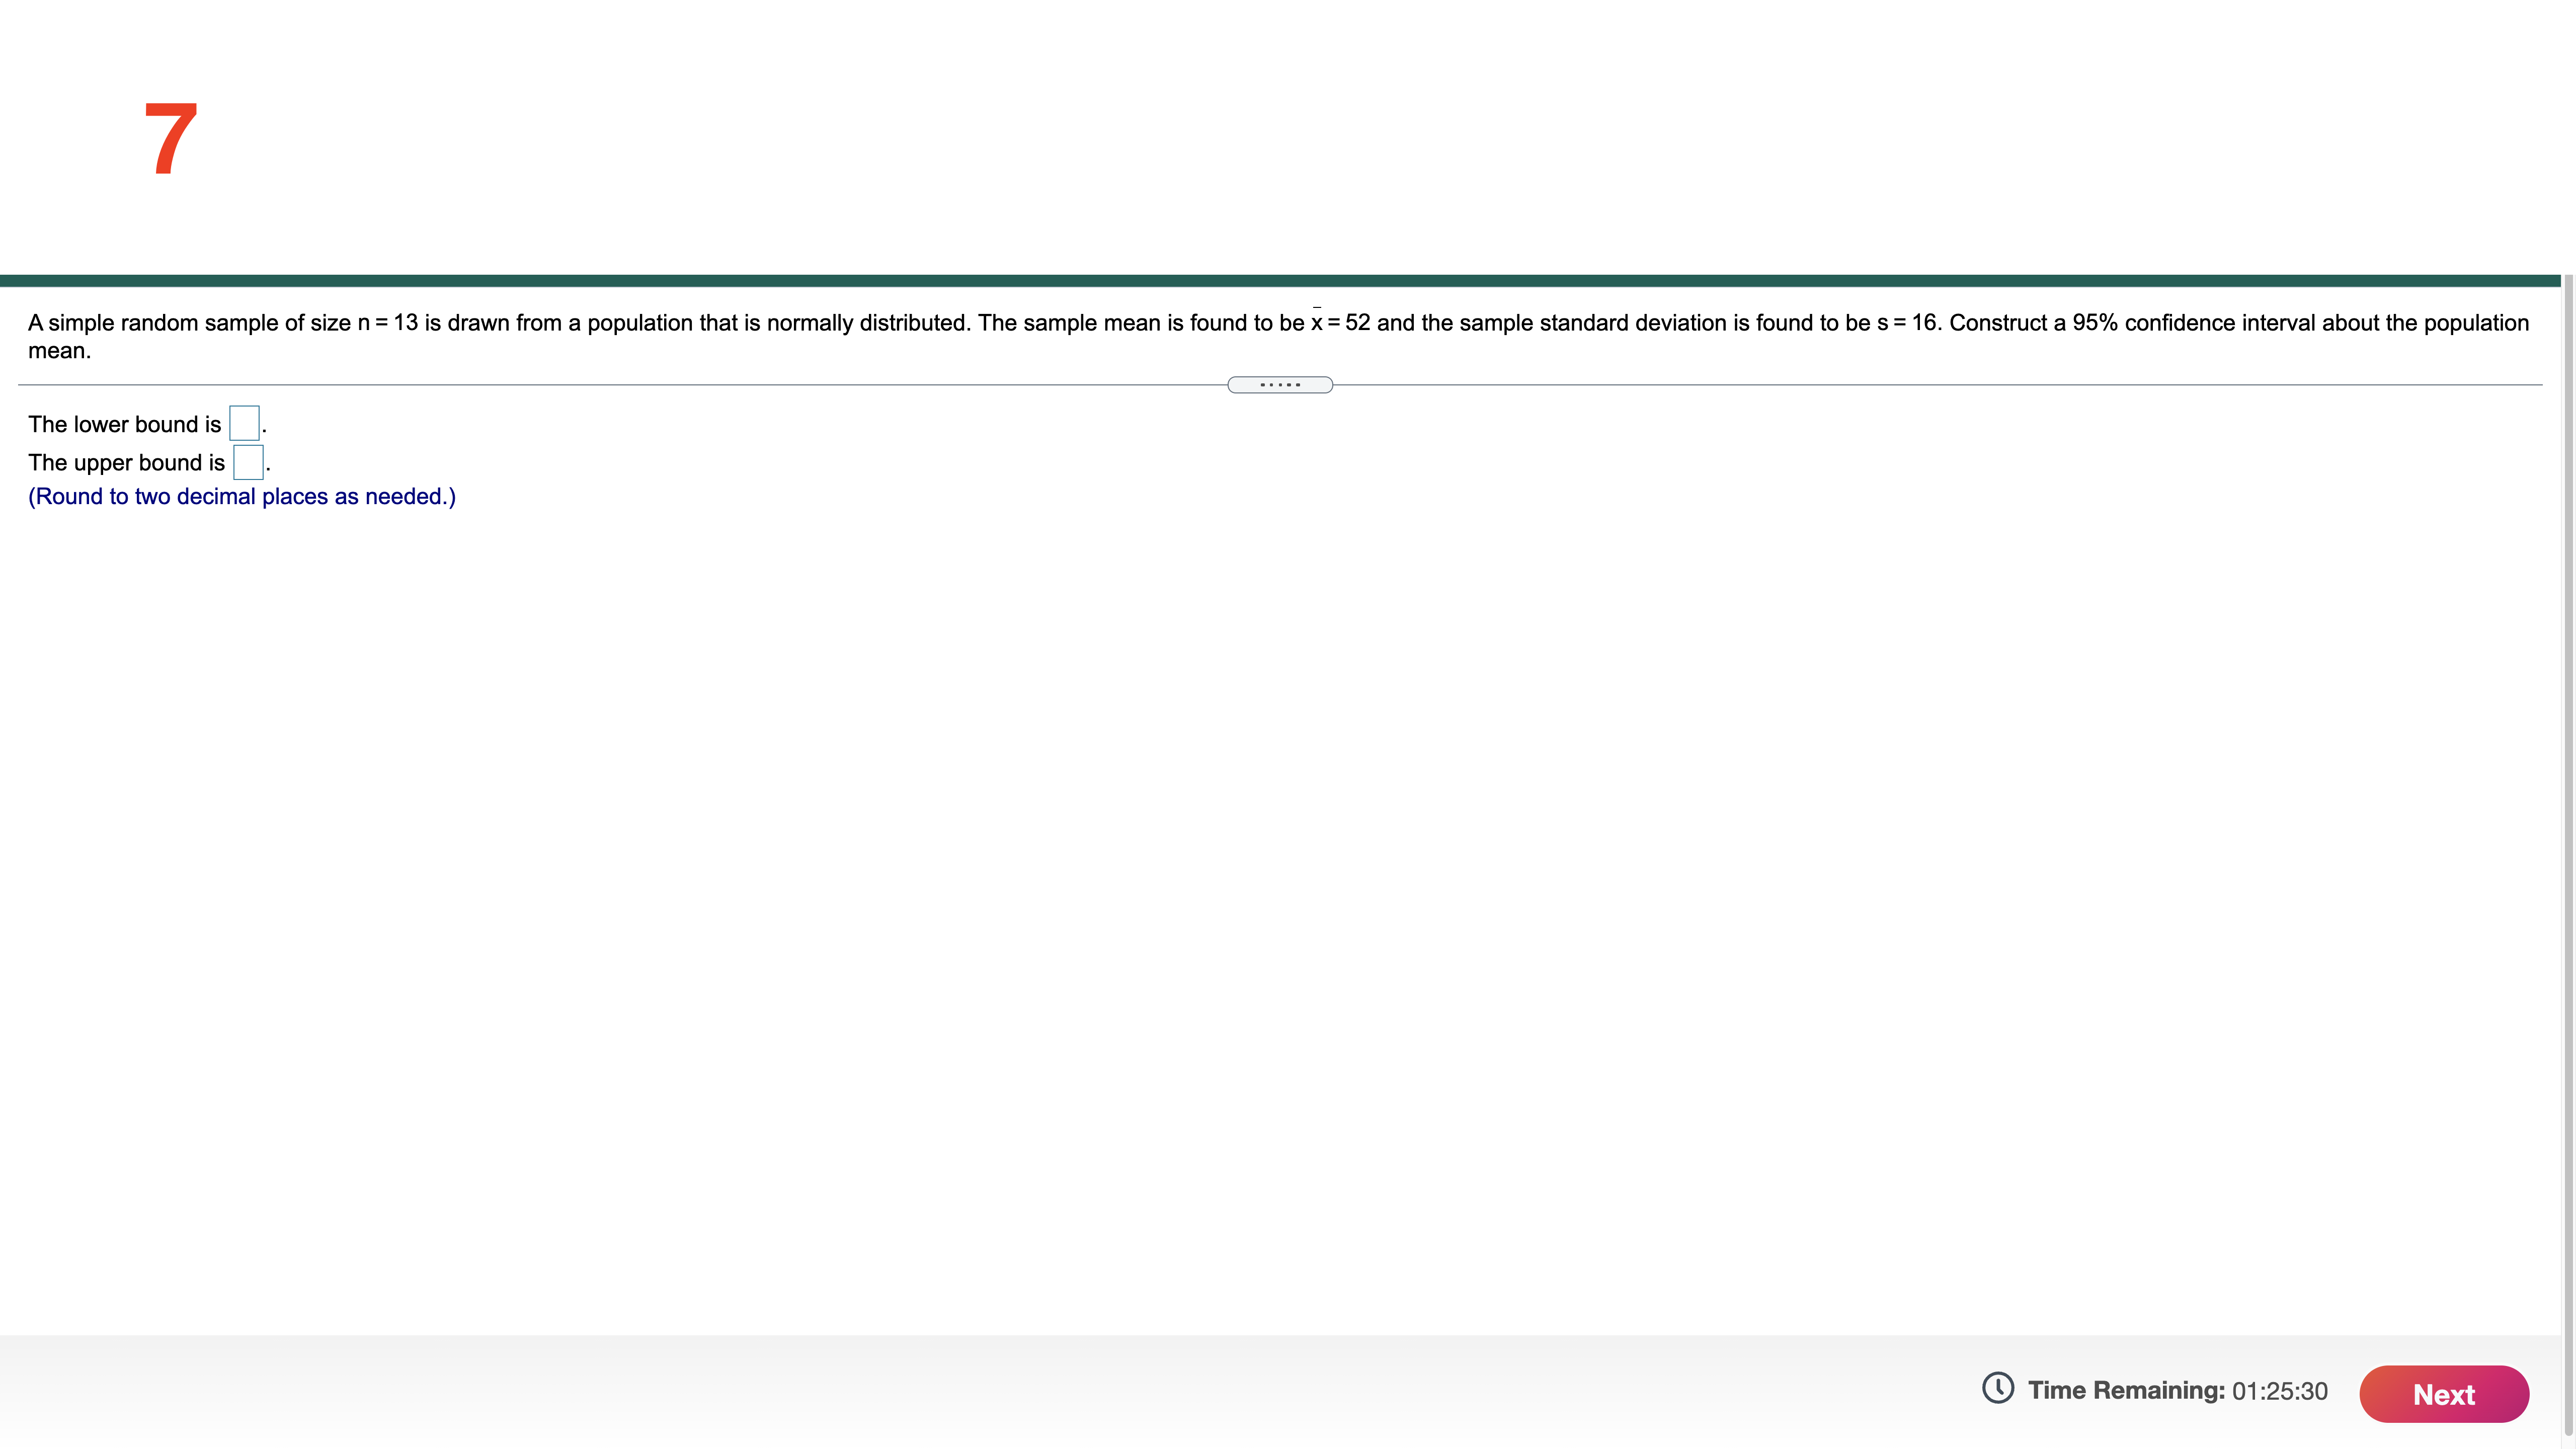
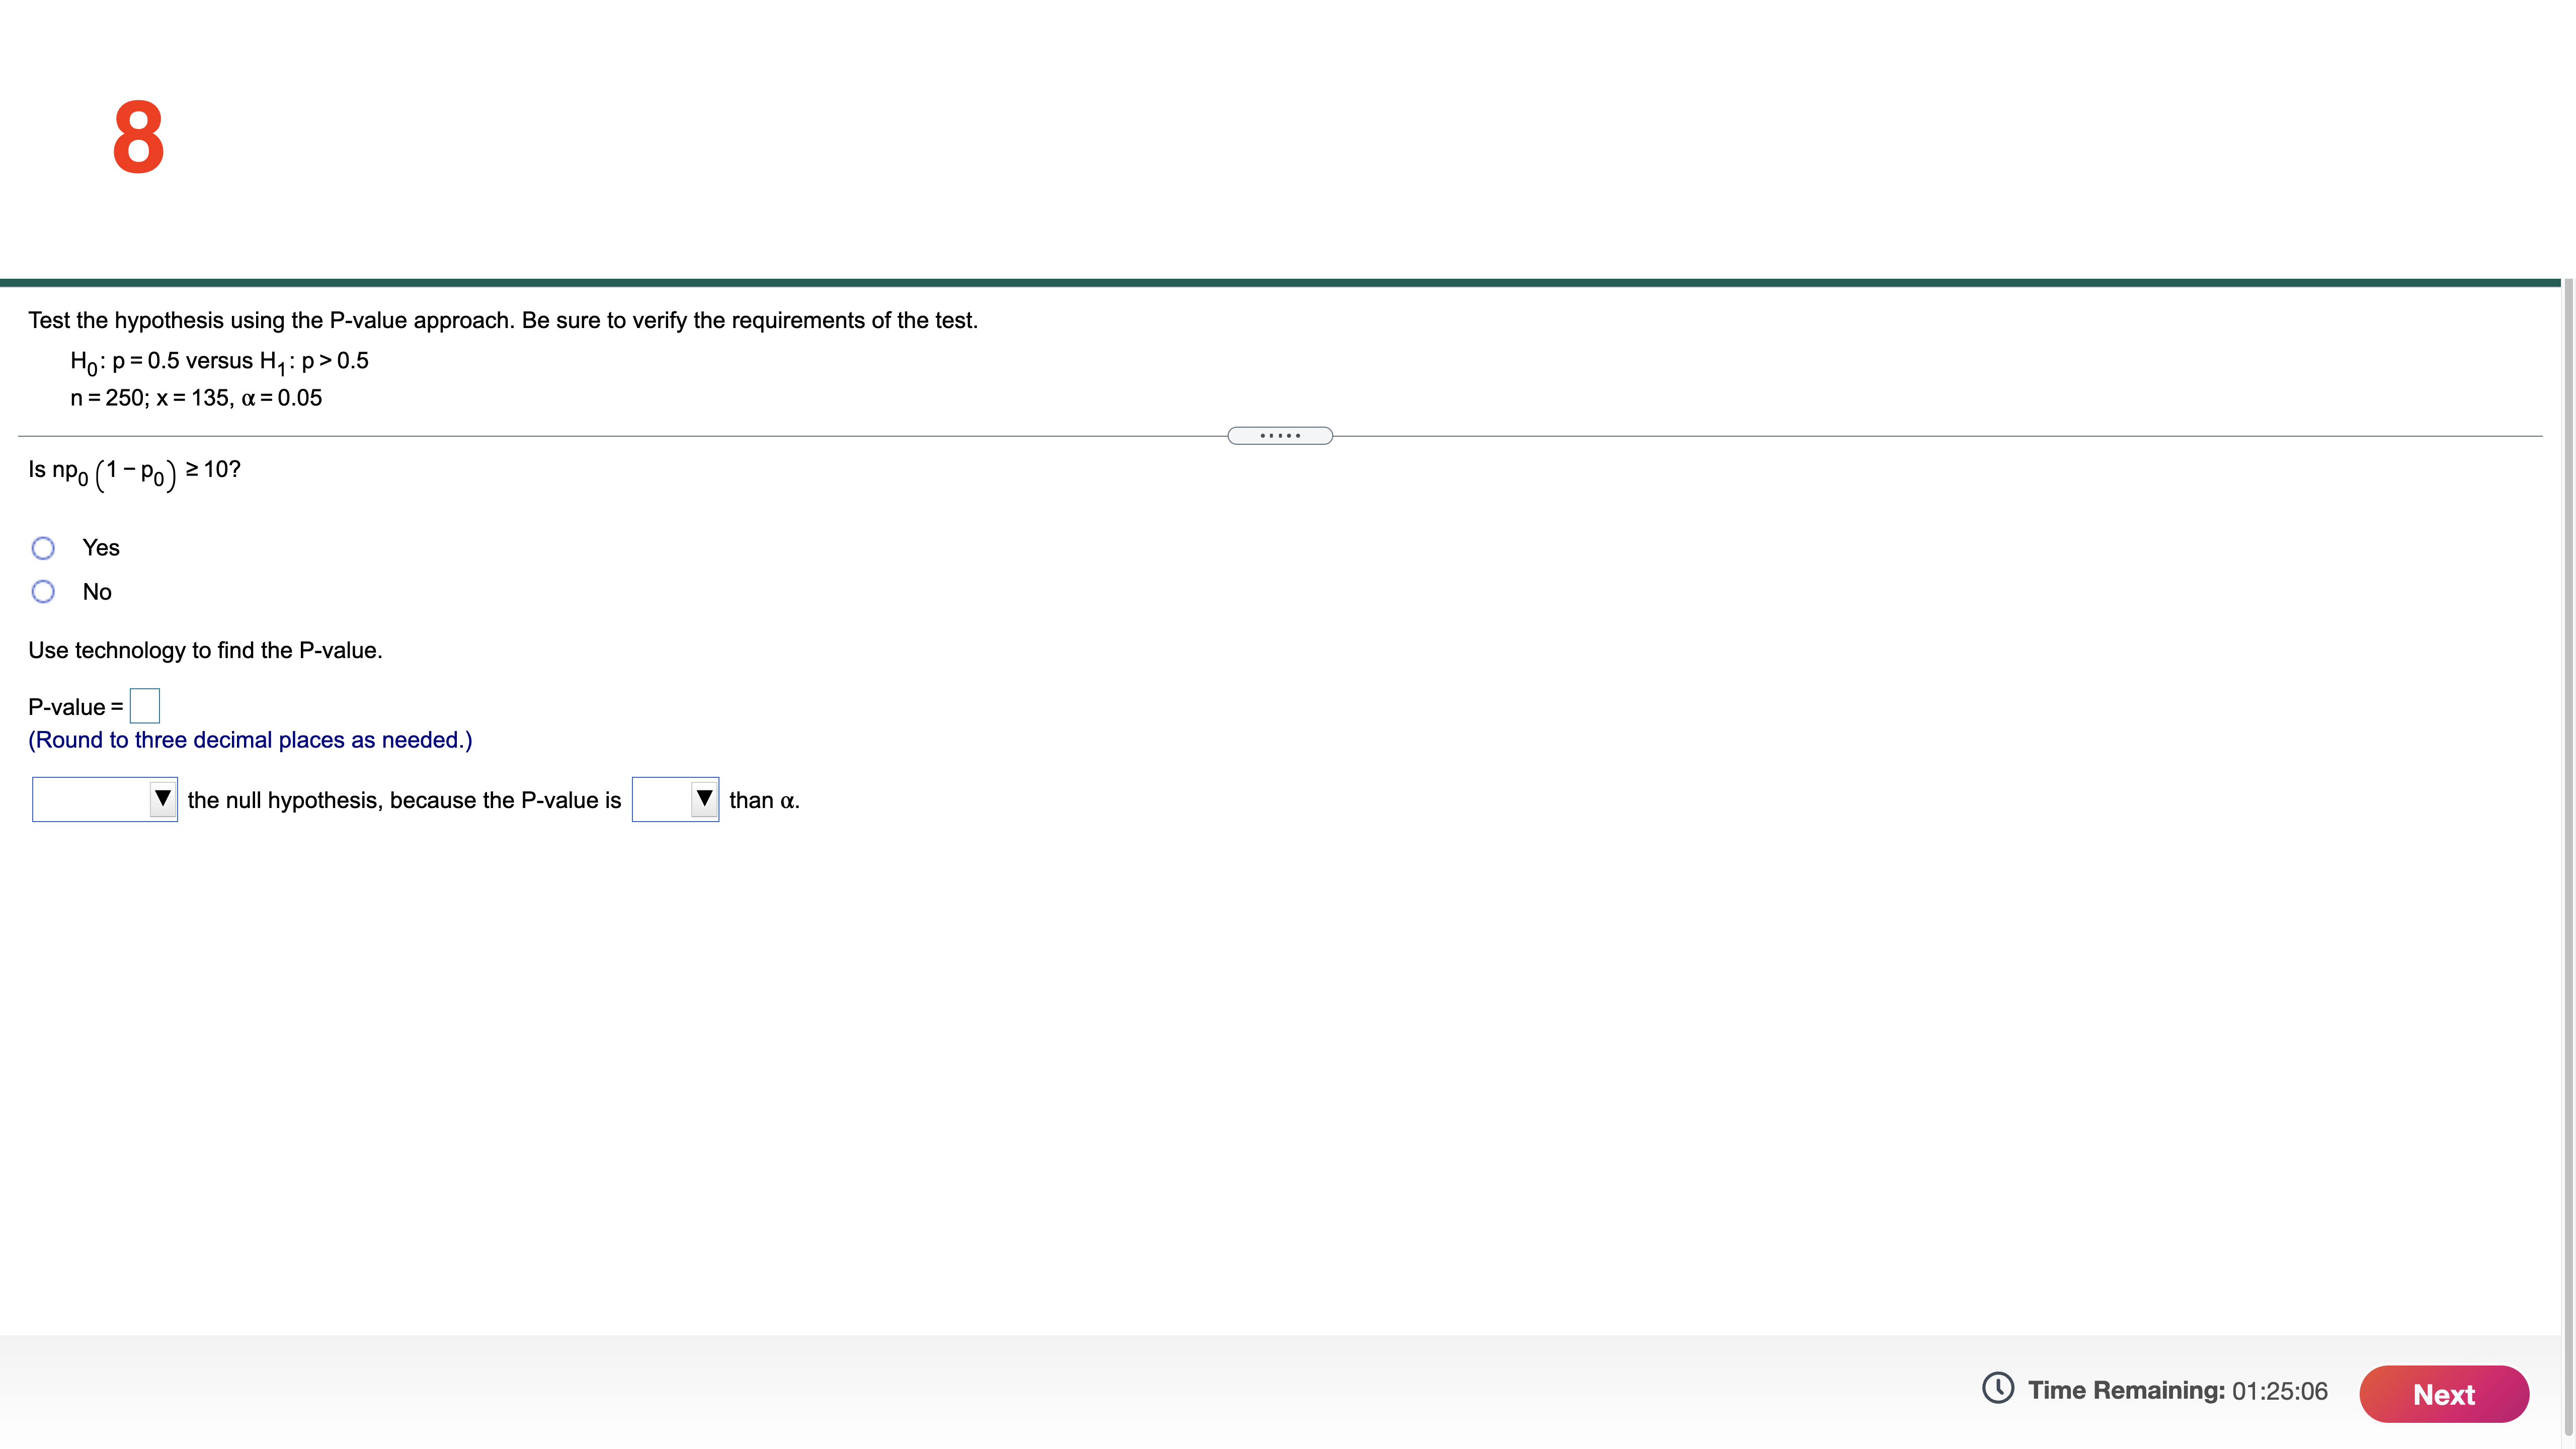
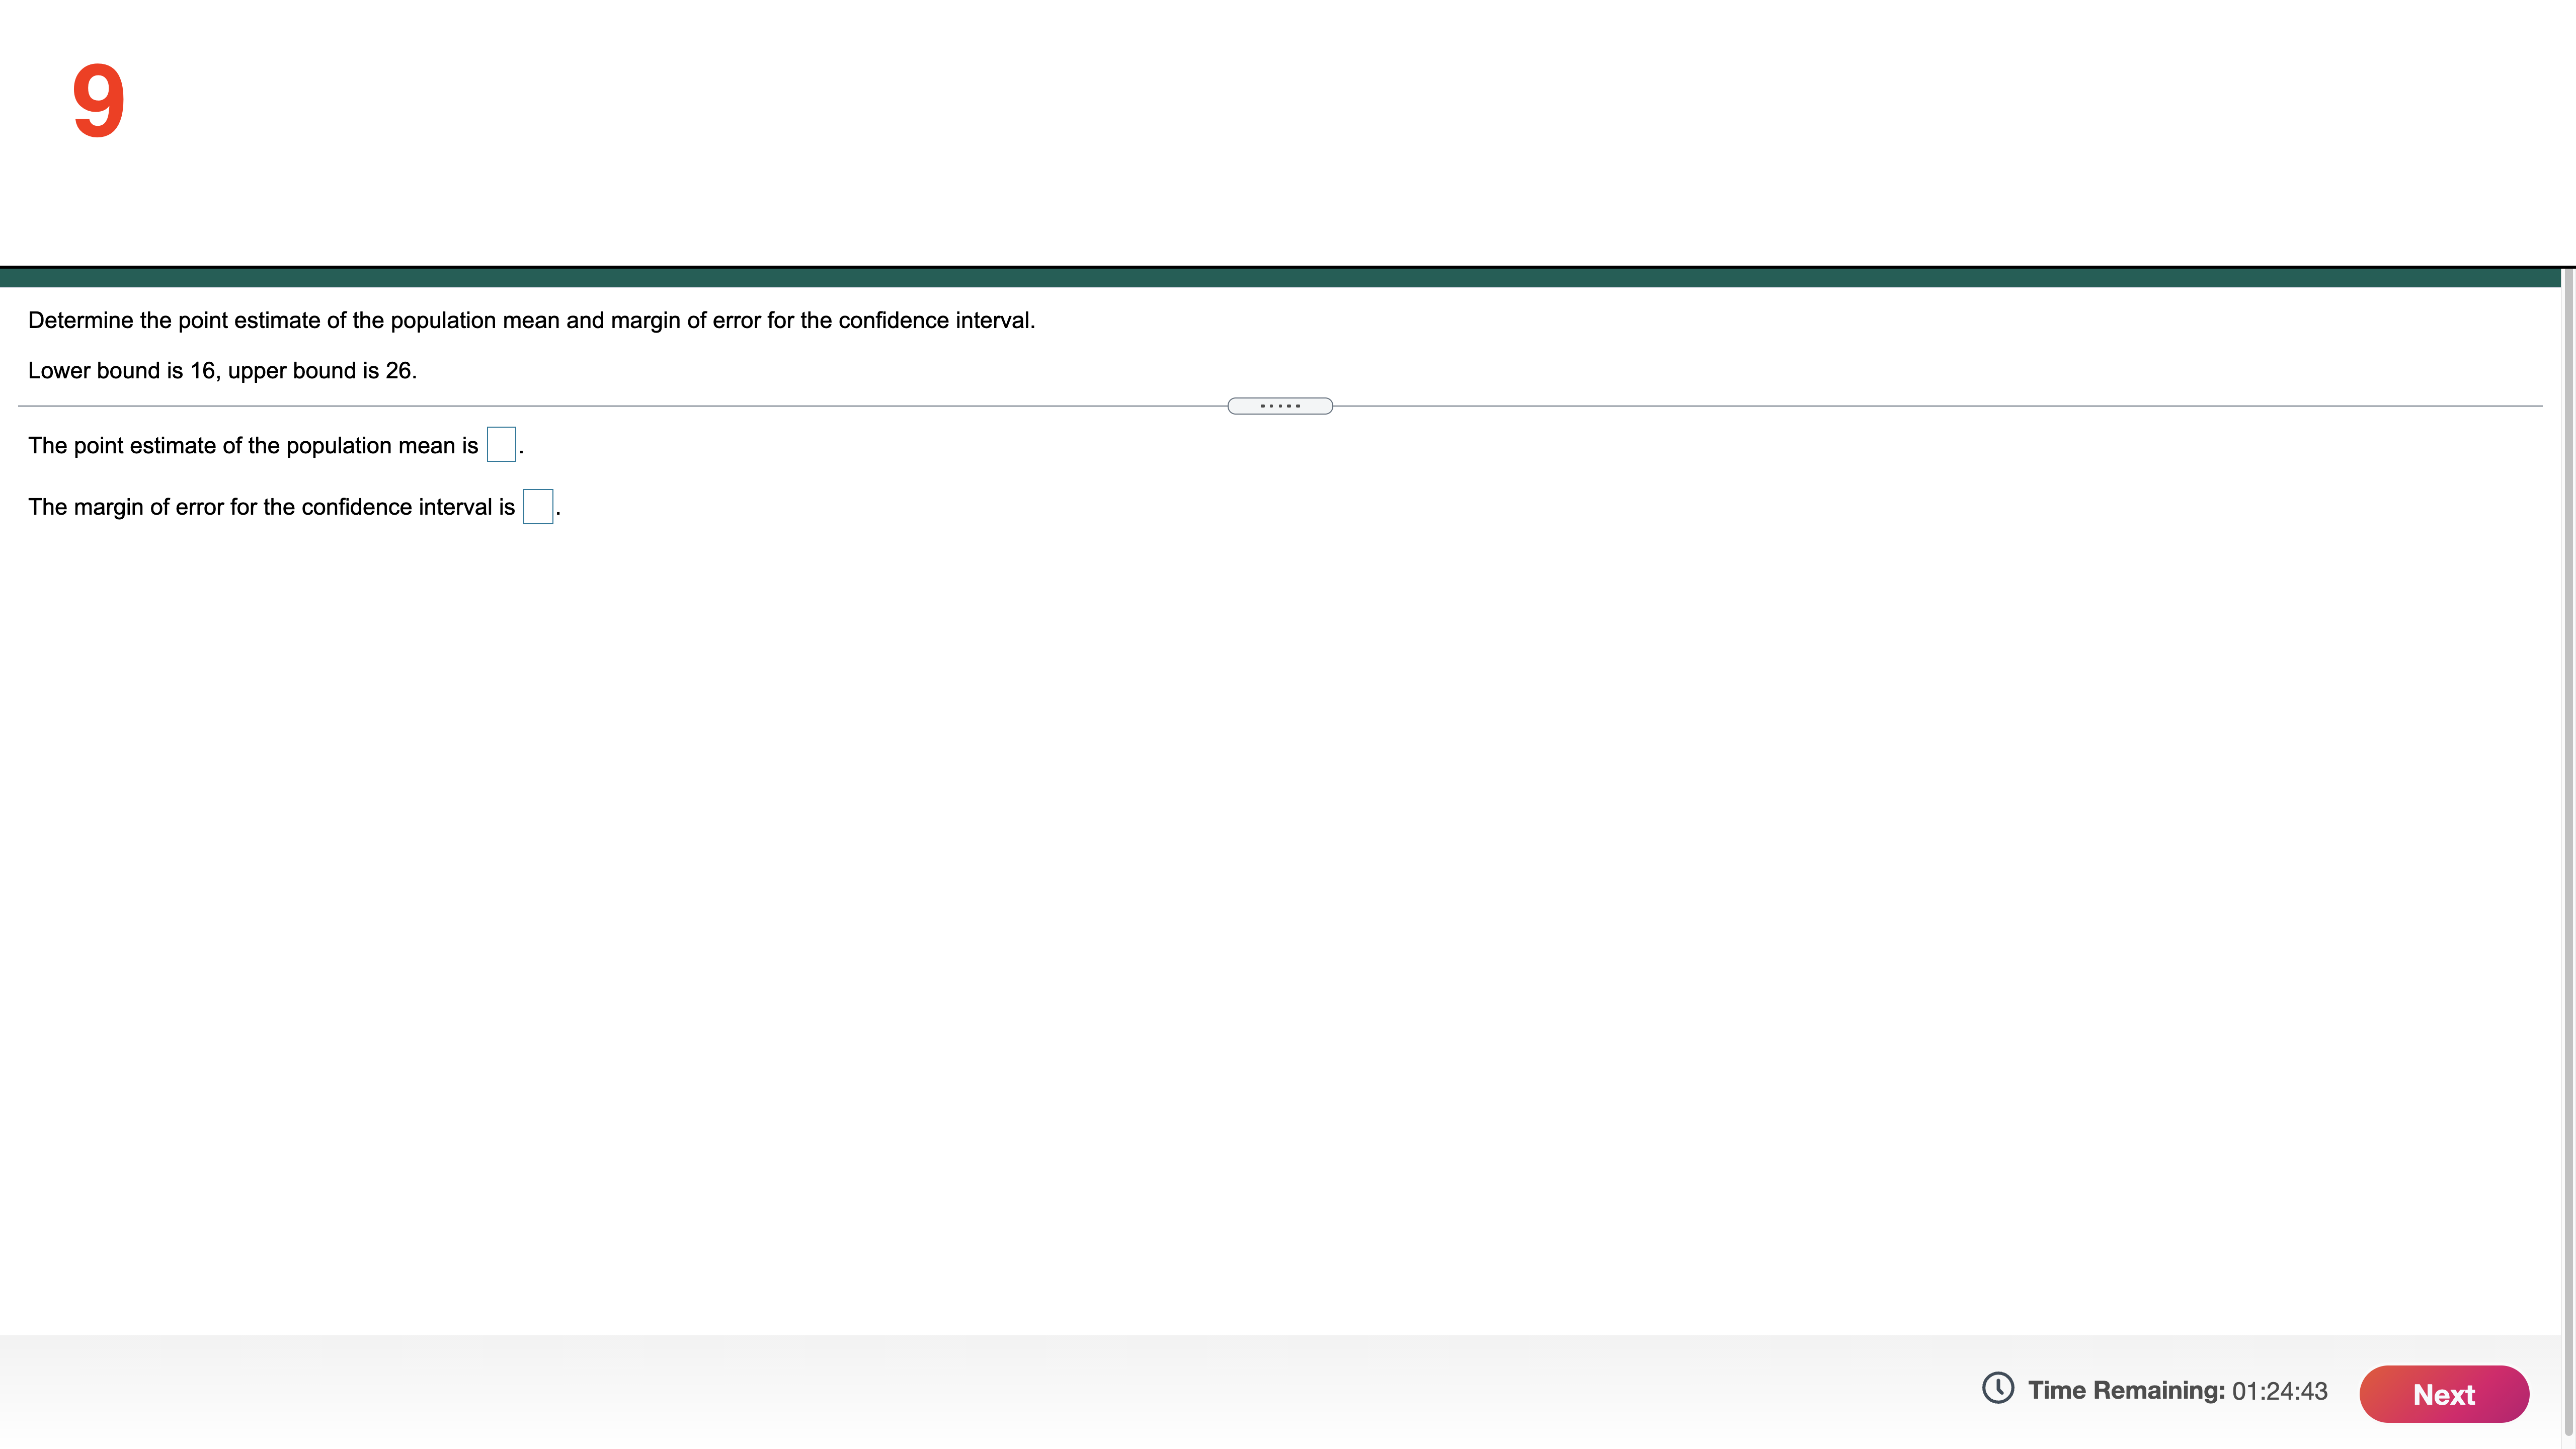
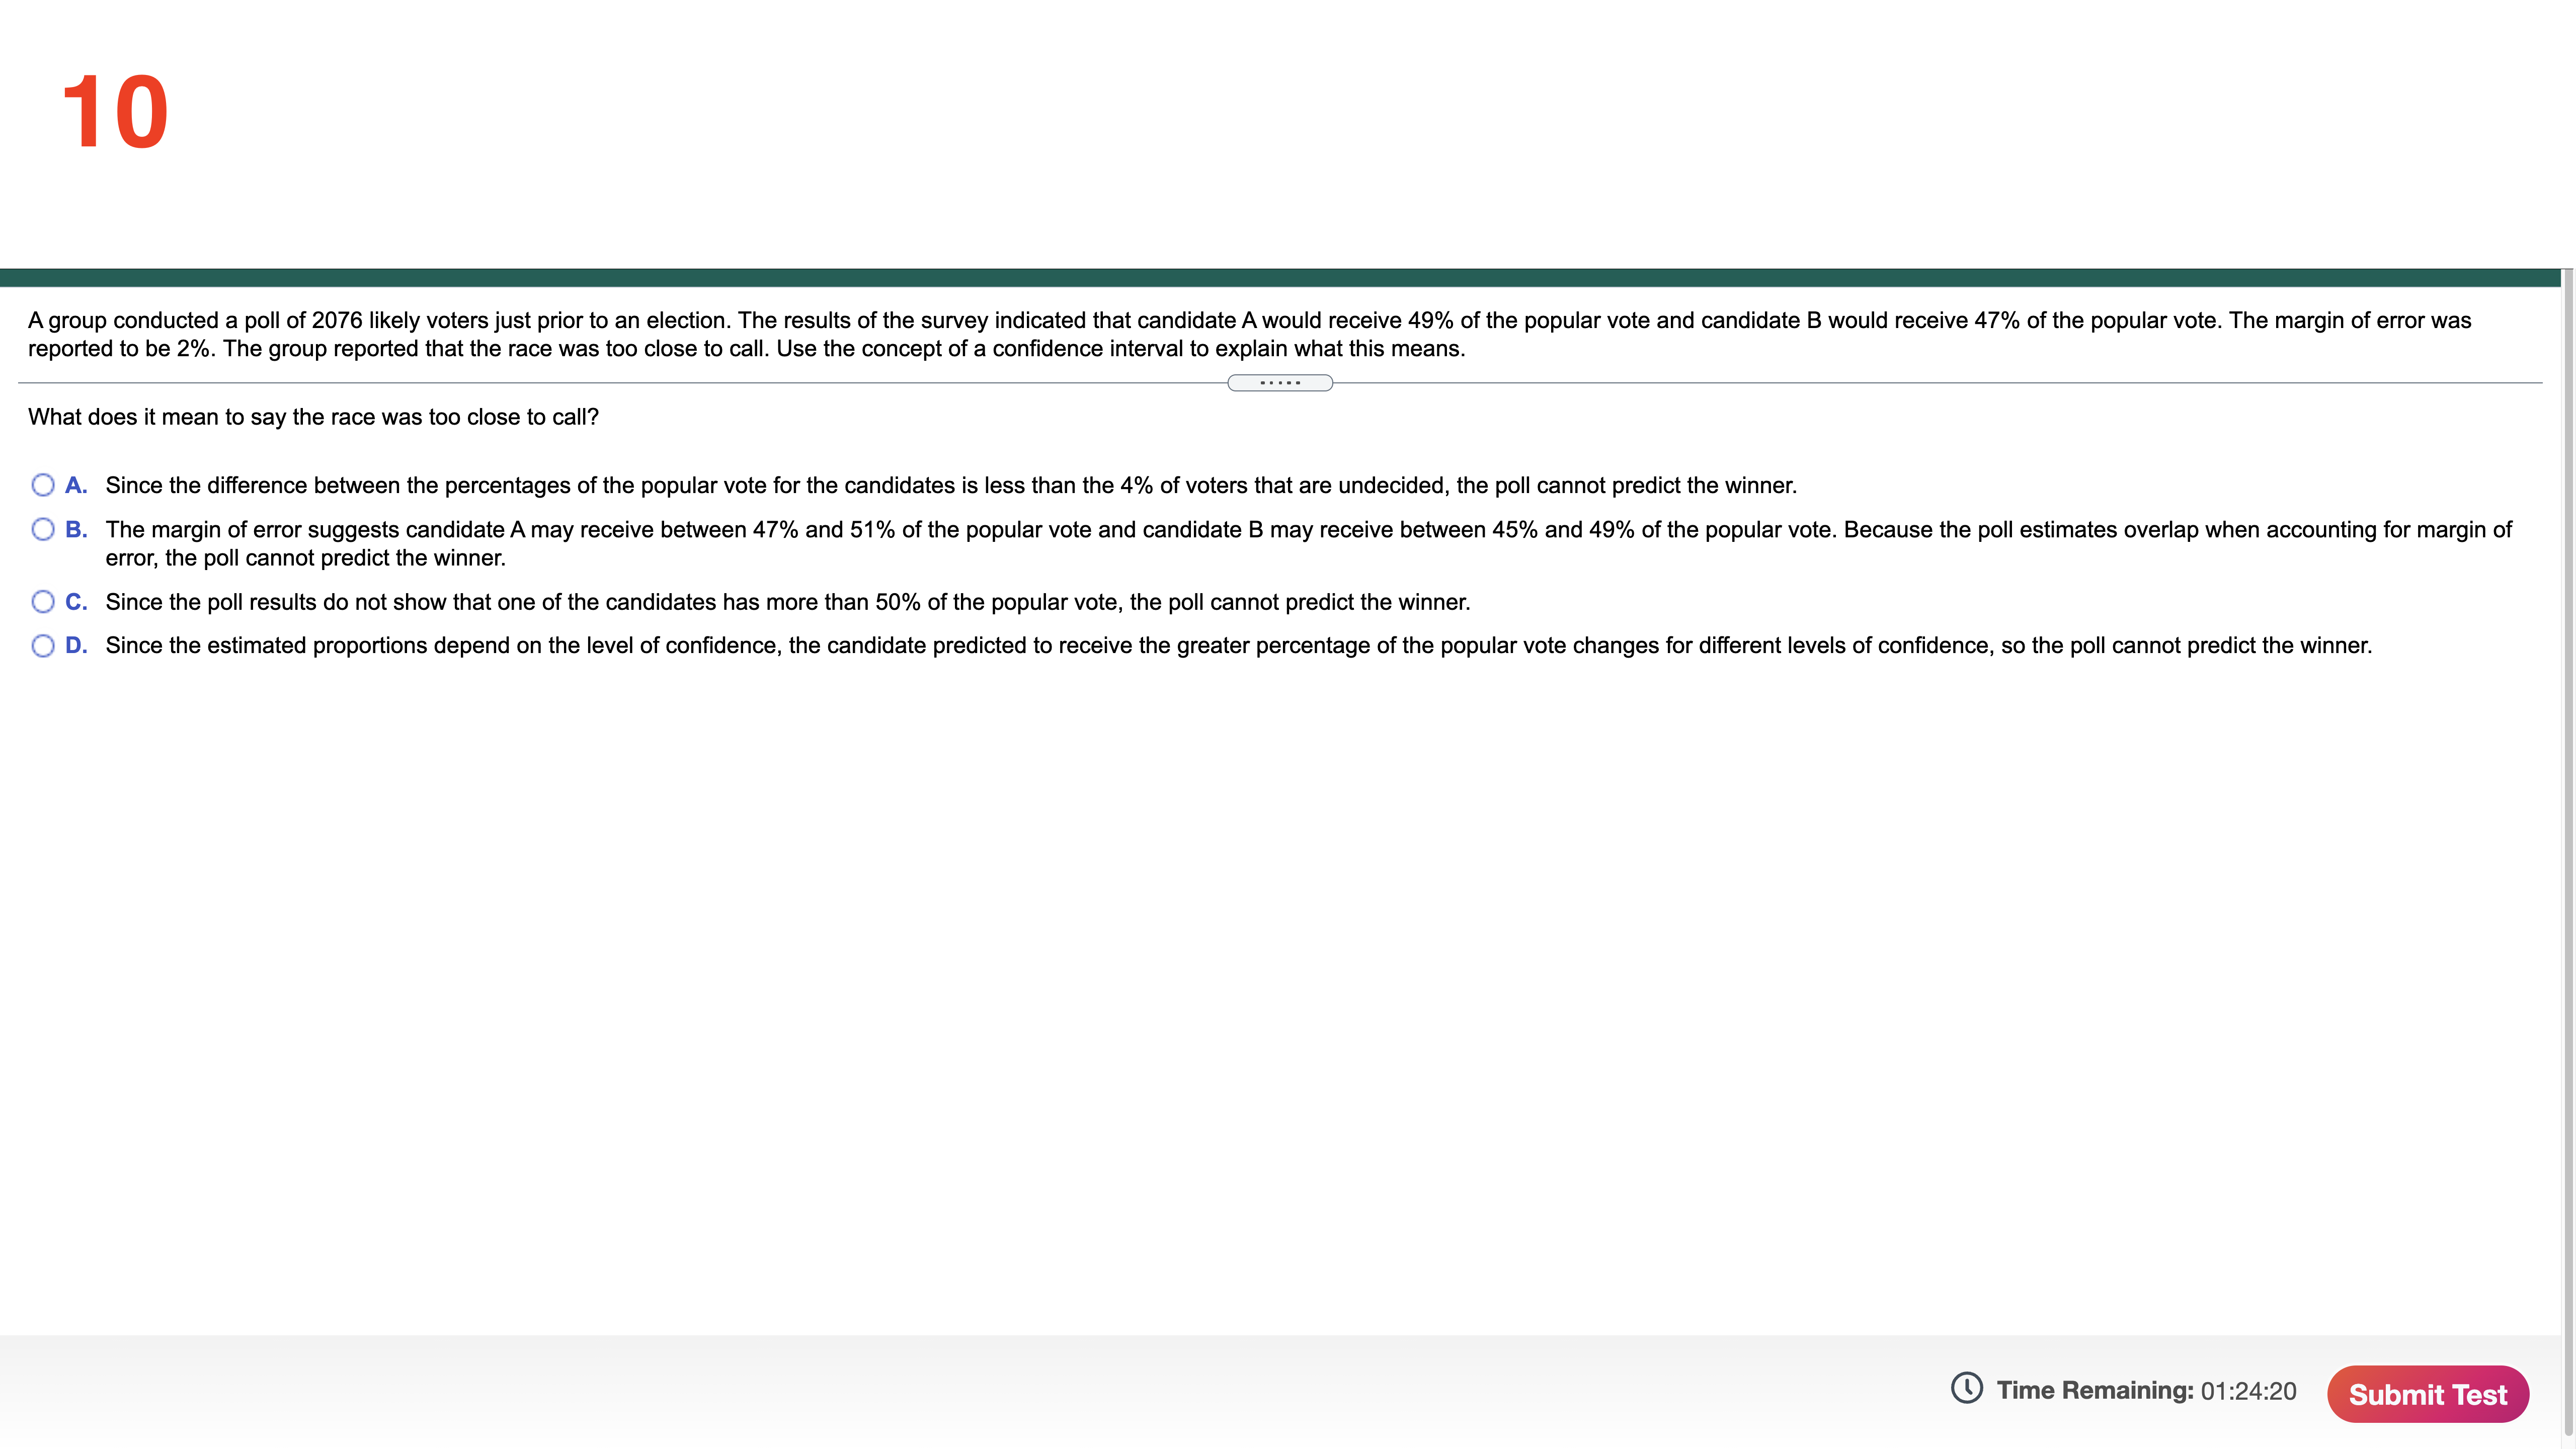
5 The null and alternative hypotheses are given. Determine whether the hypothesis test is left-tailed, right-tailed, or two-tailed. What parameter is being tested? Ho 0 = 130 o # 130 Is the hypothesis test left-tailed, right-tailed, or two-tailed? O Right-tailed test Two-tailed test Left-tailed test What parameter is being tested? O Population proportion Population mean d deviation Time Remaining: 01:26:32 Next6 A simple random sample of size n = 40 is drawn from a population. The sample mean is found to be 109.4, and the sample standard deviation is found to be 23.1. Is the population mean greater than 100 at the a = 0.05 level of significance? Determine the null and alternative hypotheses. Ho H 1 : Compute the test statistic. =(Round to two decimal places as needed.) Determine the P-value. The P-value is . (Round to three decimal places as needed.) What is the result of the hypothesis test? the null hypothesis because the P-value is the level of significance. At the a = 0.05 level of significance, the population mean V Time Remaining: 01:25:54 Next7 A simple random sample of size n = 13 is drawn from a population that is normally distributed. The sample mean is found to be x = 52 and the sample standard deviation is found to be s = 16. Construct a 95% confidence interval about the population mean. The lower bound is. The upper bound is (Round to two decimal places as needed.) Time Remaining: 01:25:30 NextTest the hypothesis using the P-value approach. Be sure to verify the requirements of the test. Ho: p = 0.5 versus H, : p > 0.5 = 250; x = 135, a = 0.05 Is npo (1 - Po ) 2 10? O Yes O No Use technology to find the P-value. P-value = (Round to three decimal places as needed.) the null hypothesis, because the P-value is than a. Time Remaining: 01:25:06 NextDetermine the point estimate of the population mean and margin of error for the confidence interval. Lower bound is 16, upper bound is 26. . . . . . The point estimate of the population mean is. The margin of error for the confidence interval is. Time Remaining: 01:24:43 Next10 A group conducted a poll of 2076 likely voters just prior to an election, The results of the survey indicated that candidate Awould receive 49% of the popular vote and candidate B would receive 47% of the popular vote. The margin of error was reported to be 2%. The group reported that the race was too close to call. Use the concept of a condence interval to explain what this means. What does it mean to say the race was too close to call? 0 A. Since the difference between the percentages of the popular vote for the candidates is less than the 4% of voters that are undecided, the poll cannot predict the winner. 0 B. The margin of error suggests candidate A may receive between 47% and 51% of the popular vote and candidate B may receive between 45% and 49% of the popular vote. Because the poll estimates overlap when accounting for margin of error, the poll cannot predict the winner. 0 C. Since the poll results do not show that one of the candidates has more than 50% of the popular vote, the poll cannot predict the winner. 0 D. Since the estimated proportions depend on the level of condence, the candidate predicted to receive the greater percentage of the popular vote changes for different levels of condence, so the poll cannot predict the winner. Time Remaining: 01:24:20 Submit Test
Step by Step Solution
There are 3 Steps involved in it

Get step-by-step solutions from verified subject matter experts


