Answered step by step
Verified Expert Solution
Question
1 Approved Answer
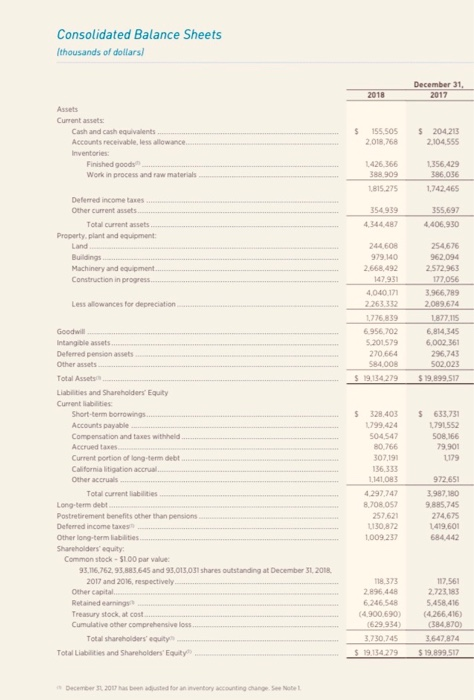
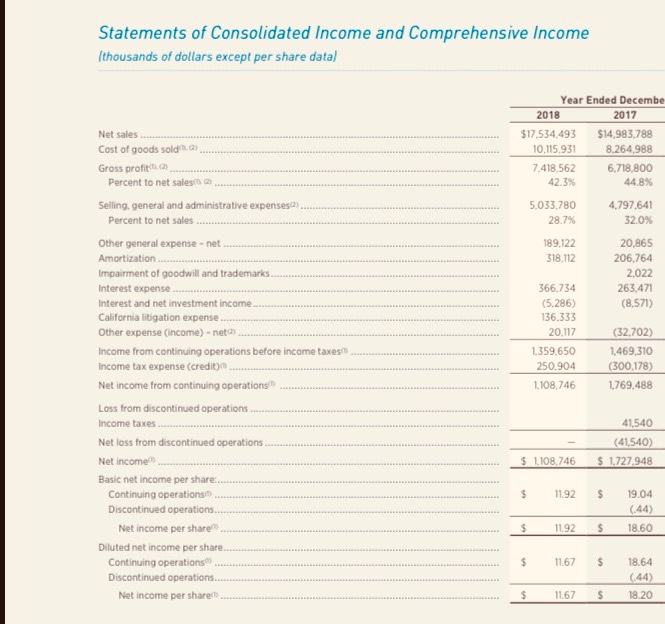
need the following all info needed is in the pictures the liquidity ratios for the years 2017, 2018 current assets/ current liabilities, current assets- current
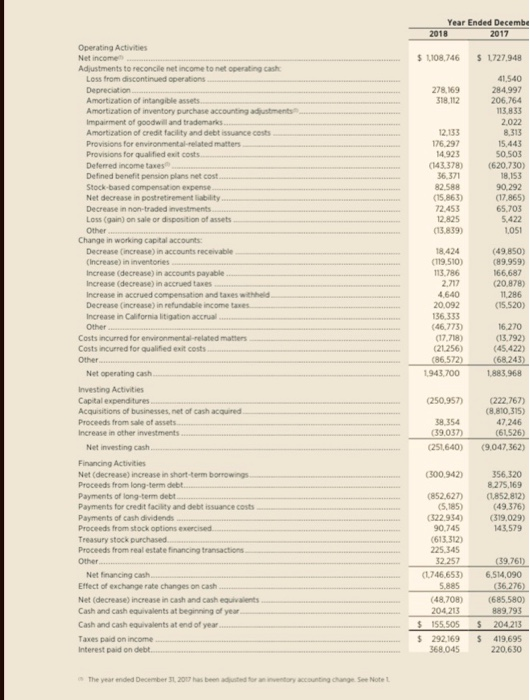
need the following 


Consolidated Balance Sheets thousands of dollars! December 31, 2017 2018 $ Assets Current assets Cash and cash equivalents ............. Accounts receivable less lowance Inventories: Finished good Work in process and raw materials 155,505 2012.168 204 213 2.104555 1156429 16056 09 1815.275 1742465 35499 3551697 409 D e income Other current Tetes Property and oment Land Bugs Machinery and woment Construction in progress ER 979.140 2.668.492 254675 9620 2572963 OSE Lesowances for depreciation 404017 2263332 1726339 Good Intang beses...... Deferred m assets Others 6956.702 5201579 270664 CR4008 3.966,789 2089 674 1877.115 6 814 345 6.002 361 296.743 502023 $19.999 517 Total Asset $911429 Llabetes and Shareholders' Equity Current Short-term borrowings. Accounts payable Come and t he Acordes Current portion of long-temet Californiations $24036179 799.424 791552 504547 16 0766 79.900 0219 1179 8.708057 25700 130872 1.009.237 972651 3.987.180 9.885.745 274.675 1419,601 684.442 Total current Long tom dett Postretirement benefits other than pensions Deemed income taxe Other long term e s Shareholders'quity Common stock - S100 par value 95.16762.95.383.645 and 93.015.03 shares outstanding at December 31, 2018 2017 and 2016, respectively Other capital Retained Treasury stock at cost. Cumulative other comprehensive loss. Total shareholders' equity Tot e s and Shareholders' Equity 118.373 2.896.448 6246548 (4.900.690) (629 934) 3.730.745 149 117.561 2223183 5.458 416 (4266.416) (384 870) 647 874 999 12 Statements of Consolidated Income and Comprehensive Income (thousands of dollars except per share data) Net sales Cost of goods sold.......................... Gross profit ...................... . ......... Percent to net sales Year Ended Decembe 2018 2017 $17.534,493 $14,983.788 10.115.931 8.264,988 7.418.562 6,718.800 42.3% 44.8% .................. .... ...... Selling general and administrative expenses)..... Percent to net sales ....... 5.033.780 28.7% 189.122 318.112 4.797.641 32.0% 20,865 206,764 2,022 263,471 (8.571) Other general expense - net...... Amortization.. Impairment of goodwill and trademarks... Interest expense............. Interest and net investment income........... California litigation expense Other expense (income) - nets2... Income from continuing operations before income taxes.. Income tax expense (credit) Net income from continuing operations ........ 366.734 (5.286) 136.333 20.117 1.359.650 250.904 1.108,746 (32,702) 1.469,310 (300,178) 1,769.488 41,540 (41,540) $ 1.727.948 $ 1108.746 $ 11.92 $ Loss from discontinued operations ..................... Income taxes Net loss from discontinued operations Net income Basic net income per share............. Continuing operations .. .. Discontinued operations........ Net income per share.......... Diluted net income per share..... Continuing operations ..... Discontinued operations...... Net income per share........ 19.04 (44) 18.60 $ 11.92 $ $ 11.67 $ 18.64 (44) 18.20 $ 11.67 $ Year Ended Decembe 2018 2017 $ 1108,746 S 1727.948 278,169 318.112 Operating Activities Net income Adjustments to reconcile net income to net operating cash Less from discontinued operations. Depreciation Amortization of intangible assets... Amortization of inventory purchase accounting adjustments Impairment of goodwill and trademarks Amortization of credit facility and debt issuance costs Provisions for environmental related matters Provisions for qualified exit costs Deferred income taxes Defined benefit pension plans et cost....... Stock-based compensation expense . Net decrease in postretirement liability... Decrease in non-traded investments Loss (gain) on sale or disposition of assets Other Change in working capital accounts: Decrease increase in accounts receivable (increase in inventories Increase (decrease in accounts payable Increase (decrease in accrued taxes . Increase in accrued compensation and taxes withheld Decrease increase) in refundable income taxes Increase in California litigation accrual Other Costs incurred for environmental-related matters Costs incurred for qualified exit costs Other 12.133 176.297 14.923 (141 3783 36 371 82 588 (15.863) 72.453 41.540 284 997 206.764 113.833 2022 8.313 15.443 50 503 (620.730 18.153 90.292 (17,865) 65.703 2825 5.422 (13.839) LOSI (49.850) (89.959) 166.687 (20.878) 11286 (15520) 18.424 (119.510) 113786 2.717 4.640 20092 136313 (46.773) (17718) (21256) (86.572) 1943.700 16.270 (13.792) (45.422) (68243) 1885968 Net operating cash.... (250.957) Investing Activities Capital expenditures Acquisitions of businesses, net of cash acquired Proceeds from sale of assets Increase in other investments (222.767) (8.810 315) 47,246 (61526) 39354 39037) (251640) Net investing cash (9.047,362) (300.942) 356.320 8.275.169 (1852.8122 (49.376) (319,029) 141 579 Financing Activities Net (decrease increase in short-term borrowing Proceeds from long-term debt. Payments of long-term debt.... Payments for credit facility and debt issuance costs Payments of cash dividends Proceeds from stock options exercised Treasury stock purchased Proceeds from real estate financing transactions Other... Net financing cash....... Effect of exchange rate changes on cash Net (decrease increase in cash and cash equivalents Cash and cash equivalents at beginning of year Cash and cash equivalents at end of year.... Taxes paid on income Interest paid on debt. (39.761) (852,627) (5.185) (522,934) 90.745 (6133120 225 345 32.257 (1746.653) 5.885 (48708) 204213 $ 155.505 $ 292169 368.045 6.514,090 636 276) (685580) 889.793 204213 419.695 220.630 $ $ The year ended December 2007 has been used for all info needed is in the pictures
the liquidity ratios for the years 2017, 2018
current assets/ current liabilities,
current assets- current liabilities,
cost of goods sold/ avg inventory,
365 days/inventory turnover
the solvency ratios for the years 2017 2018
Total Liabilities / Total Assets
NI+ Interest Exp** + Tax Exp/ Interest Exp**
^(times interest earned ratio)^


Step by Step Solution
There are 3 Steps involved in it
Step: 1

Get Instant Access to Expert-Tailored Solutions
See step-by-step solutions with expert insights and AI powered tools for academic success
Step: 2

Step: 3

Ace Your Homework with AI
Get the answers you need in no time with our AI-driven, step-by-step assistance
Get Started


