Answered step by step
Verified Expert Solution
Question
1 Approved Answer
note that i have following column names in my excel sheet with standard corresponding data . . Project _ ID , Crop,SamplE _ ID ,
note that i have following column names in my excel sheet with standard corresponding data ProjectIDCrop,SamplEIDAttemptedDataPoints,DataPointsDelivered,ArrivalDate,DueDate and CompletionDate this project, the lab supervisors would like to know how well the lab has delivered data to our partners. There are two main areas of interest. They are looking for insights into data quality across projects on a monthly basis for For example, how many datapoints did the lab deliver, and what is the success rate pass rate each month of While data quality across all projects is important, leadership would also like to know how well each crop is performing in the lab as well. The lab's goal is to deliver data on of all datapoints attempted each month. It would be great to understand if they are meeting that threshold. They would also like to know how well we are doing at delivering projects on time. Do we deliver on or before the due date? We usually define that as Time Delivery OTD What is the average turnaround time TAT Again, insights on a monthly basis would be great. Leadership is only concemed with the overall here, no need to look into how these metrics look like for each crop. Anival date, expected due date, and project completion date are all provided. The lab is striving to hit an average OTD of and TAT of days. Using Python, read in the sample data csv and provide insights into the two points above. Please provide a tables of the metrics. Plots would also be helpful. Many times, we have to present this data to leadership. A powerpoint slide or two or document sharing insights into this data would help organize everything, and make it easy to share. Please provide enough context so I can understand what each tableplot is showing. Please send me your solution code, slidedoc of insights plots tables, etc DELIVFRARLES: PPT SLIDES Report pages PYTHON Solution code, slidedoc of insights plots tables, etc 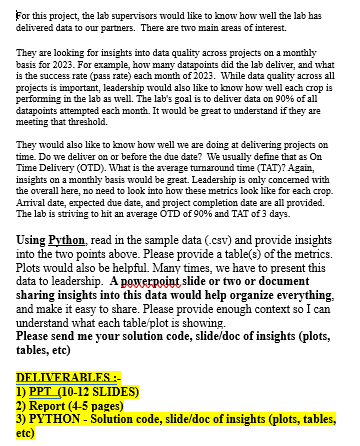
note that i have following column names in my excel sheet with standard corresponding data ProjectIDCrop,SamplEIDAttemptedDataPoints,DataPointsDelivered,ArrivalDate,DueDate and CompletionDate
this project, the lab supervisors would like to know how well the lab has
delivered data to our partners. There are two main areas of interest.
They are looking for insights into data quality across projects on a monthly
basis for For example, how many datapoints did the lab deliver, and what
is the success rate pass rate each month of While data quality across all
projects is important, leadership would also like to know how well each crop is
performing in the lab as well. The lab's goal is to deliver data on of all
datapoints attempted each month. It would be great to understand if they are
meeting that threshold.
They would also like to know how well we are doing at delivering projects on
time. Do we deliver on or before the due date? We usually define that as
Time Delivery OTD What is the average turnaround time TAT Again,
insights on a monthly basis would be great. Leadership is only concemed with
the overall here, no need to look into how these metrics look like for each crop.
Anival date, expected due date, and project completion date are all provided.
The lab is striving to hit an average OTD of and TAT of days.
Using Python, read in the sample data csv and provide insights
into the two points above. Please provide a tables of the metrics.
Plots would also be helpful. Many times, we have to present this
data to leadership. A powerpoint slide or two or document
sharing insights into this data would help organize everything,
and make it easy to share. Please provide enough context so I can
understand what each tableplot is showing.
Please send me your solution code, slidedoc of insights plots
tables, etc
DELIVFRARLES:
PPT SLIDES
Report pages
PYTHON Solution code, slidedoc of insights plots tables,
etc
Step by Step Solution
There are 3 Steps involved in it
Step: 1

Get Instant Access to Expert-Tailored Solutions
See step-by-step solutions with expert insights and AI powered tools for academic success
Step: 2

Step: 3
Ace Your Homework with AI
Get the answers you need in no time with our AI-driven, step-by-step assistance
Get Started