Question
NOTE: Use 4 decimals for all your calculations and answers. If it's not possible, use 3 or 2 decimals depending on the situation, but for
NOTE: Use 4 decimals for all your calculations and answers. If it's not possible, use 3 or 2 decimals depending on the situation, but for the vast majority of calculations and answers, 4 decimals will be the norm.
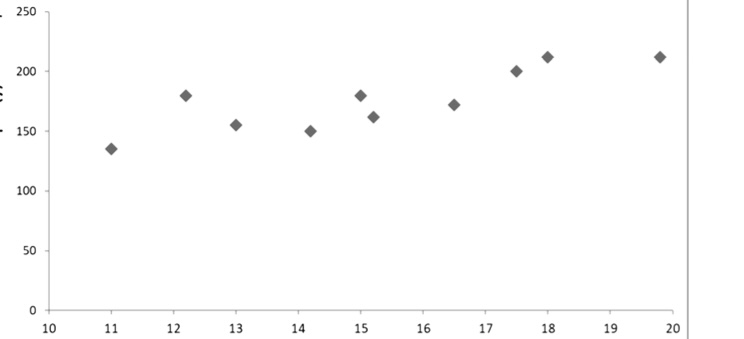
The sales manager of various branches of a sports equipment store has launched a national advertising campaign for a few months. The monthly costs (in thousands of dollars) for advertising over a 10-month period and the corresponding net revenue (in thousands of dollars) before tax are presented in the table below.
| Month | Net Revenue Before Tax (y) $000 | Monthly Ad Cost (x) $000 |
| January | 135 | 11 |
| February | 212 | 18 |
| March | 180 | 12.2 |
| April | 212 | 19.8 |
| May | 200 | 17.5 |
| June | 162 | 15.2 |
| July | 150 | 14.2 |
| August | 172 | 16.5 |
| September | 155 | 13 |
| October | 180 | 15 |
Based on the distribution of the points, one can assume that there is a linear relationship between these two variables.
a) Identify i) the dependent variable; ii) the independent variable. b) Determine the coefficients of the regression line given that NOTE: You must use a different formula than the one in d) for b1. n = 10 ?xy = 27340 x? = 15.2400 y? = 175.8000 sx = 7.6093 sy = 689.9556 c) Calculate the correlation coefficient between the two variables using the expression r = (?xiyi - n x? y?) / ((n - 1)sx sy) d) Verify the slope calculation of the regression line using the expression b1 = r (sy / sx) e) The manager wants to spend $17,000 on advertising in November. What net revenue can she expect if she uses the regression equation as a prediction tool? f) The assistant manager suggests a big push and spending $24,000 on advertising. Do you think the suggestion is "reasonable"? Explain.

Step by Step Solution
There are 3 Steps involved in it
Step: 1

Get Instant Access to Expert-Tailored Solutions
See step-by-step solutions with expert insights and AI powered tools for academic success
Step: 2

Step: 3

Ace Your Homework with AI
Get the answers you need in no time with our AI-driven, step-by-step assistance
Get Started


