

Answered step by step
Verified Expert Solution
Question
1 Approved Answer
ONLY A & C PLEASE. Please show all work in excel. 8.6. Reconsider the portfolio selection example, including its spreadsheet model in Figure 8.13, given
ONLY A & C PLEASE. Please show all work in excel.
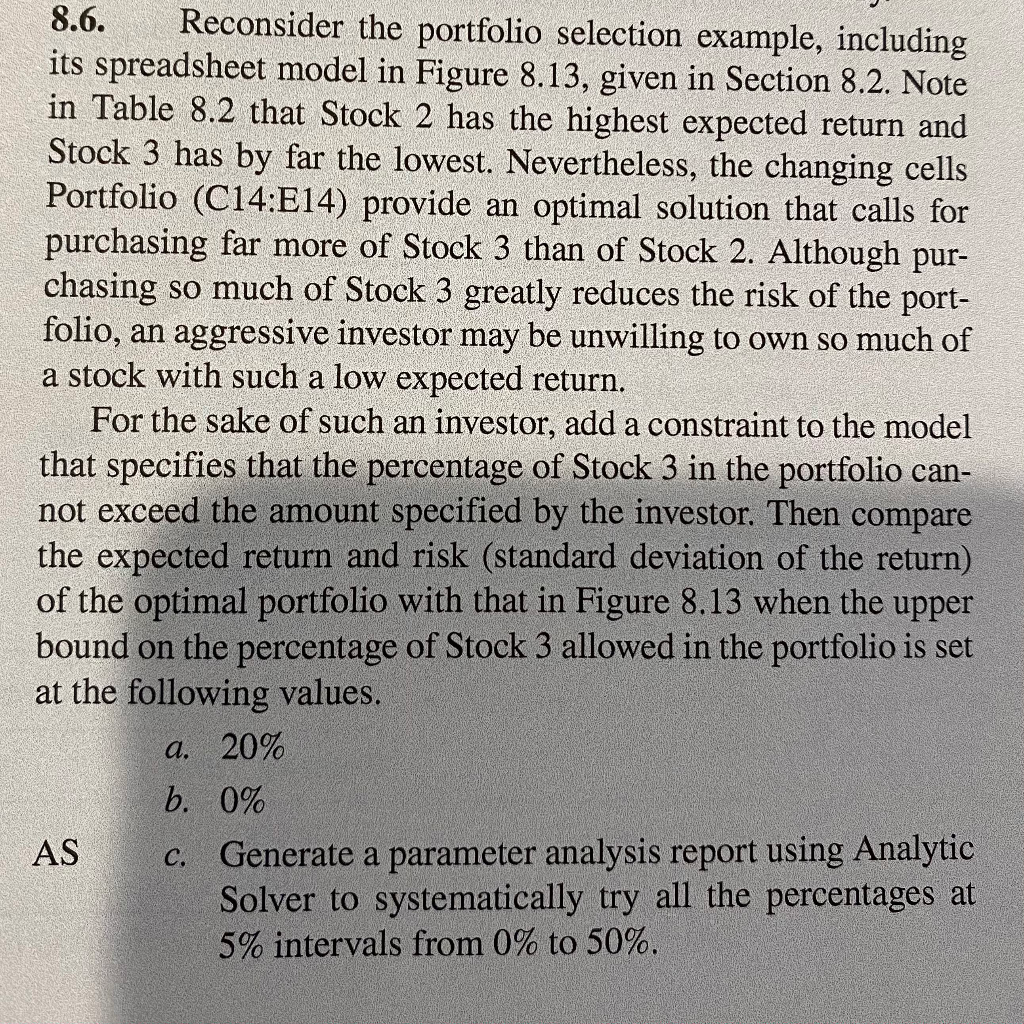
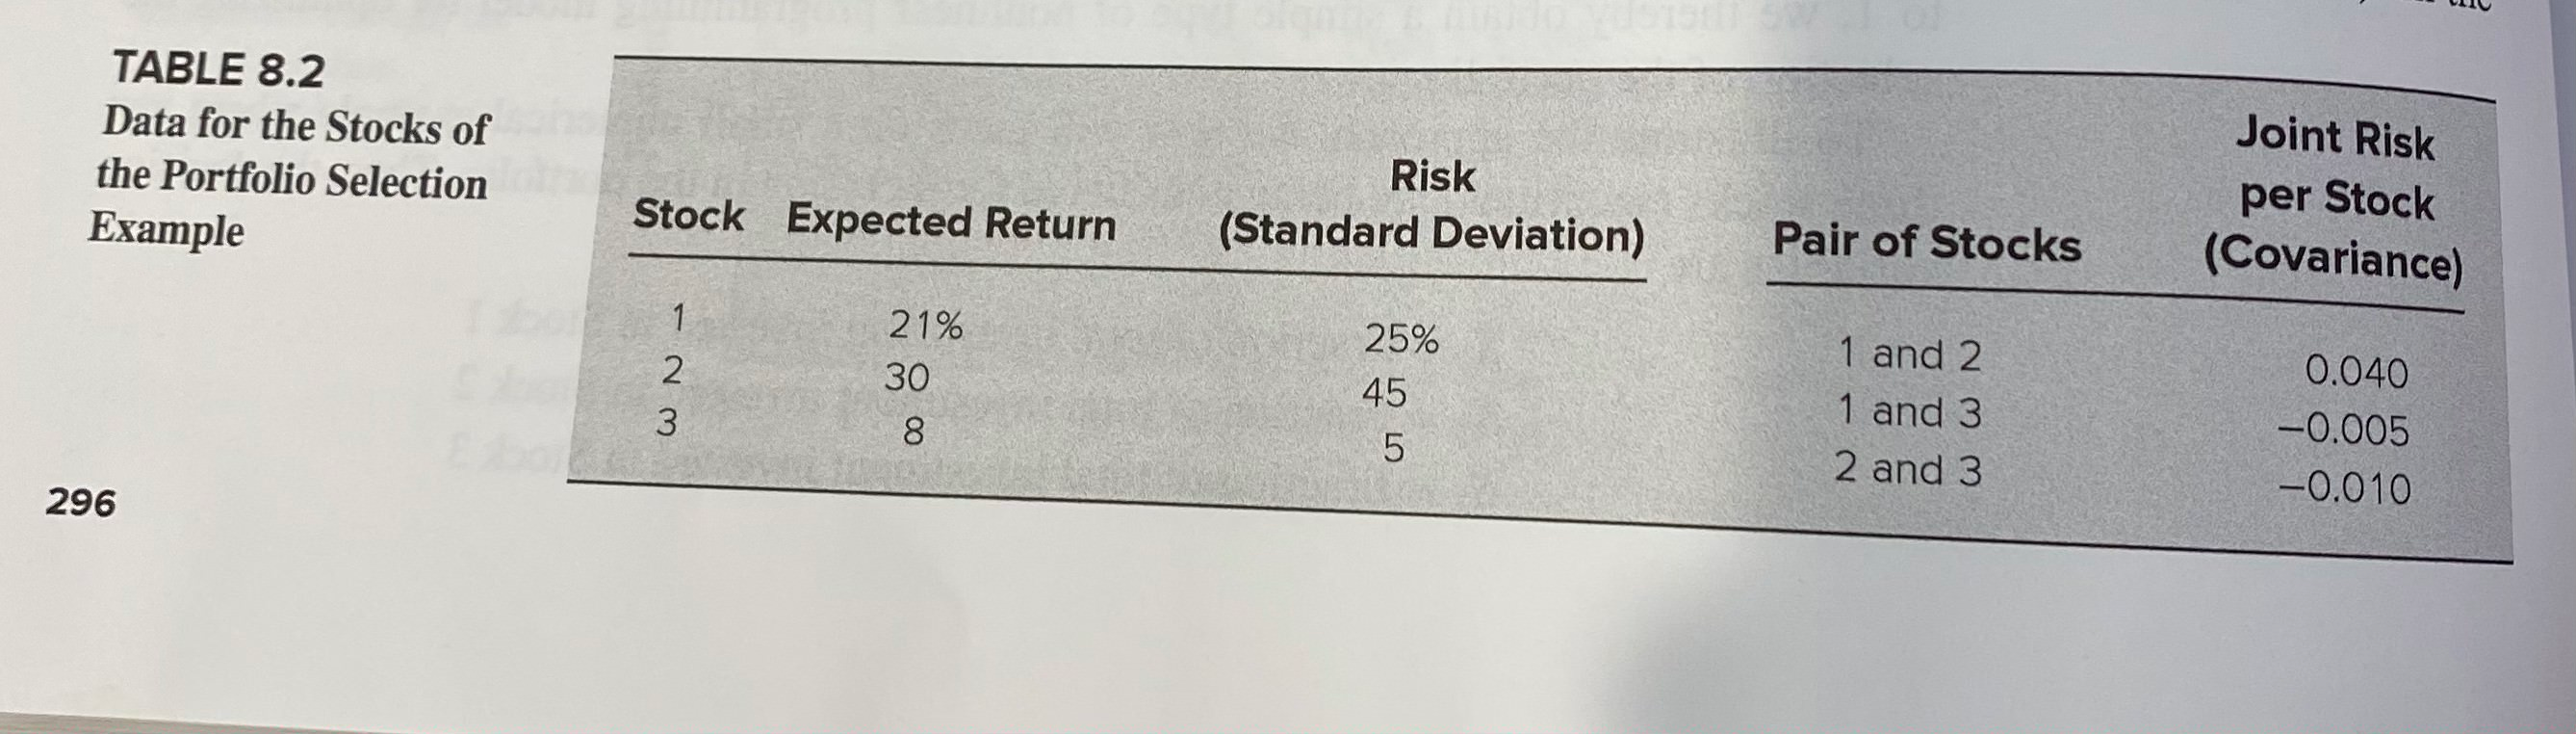
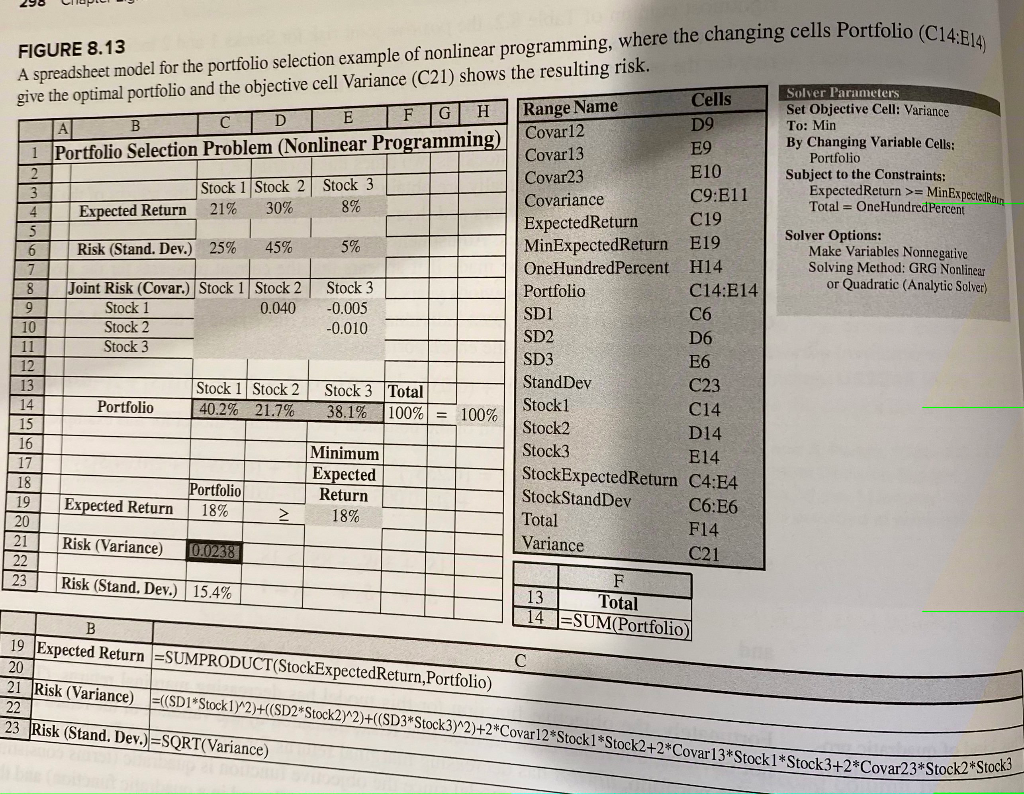
8.6. Reconsider the portfolio selection example, including its spreadsheet model in Figure 8.13, given in Section 8.2. Note in Table 8.2 that Stock 2 has the highest expected return and Stock 3 has by far the lowest. Nevertheless, the changing cells Portfolio (C14:E14) provide an optimal solution that calls for purchasing far more of Stock 3 than of Stock 2. Although pur- chasing so much of Stock 3 greatly reduces the risk of the port- folio, an aggressive investor may be unwilling to own so much of a stock with such a low expected return. For the sake of such an investor, add a constraint to the model that specifies that the percentage of Stock 3 in the portfolio can- not exceed the amount specified by the investor. Then compare the expected return and risk (standard deviation of the return) of the optimal portfolio with that in Figure 8.13 when the upper bound on the percentage of Stock 3 allowed in the portfolio is set at the following values. a. 20% b. 0% AS Generate a parameter analysis report using Analytic Solver to systematically try all the percentages at 5% intervals from 0% to 50%. C. TABLE 8.2 Data for the Stocks of the Portfolio Selection Example Stock Expected Return Risk (Standard Deviation) Joint Risk per Stock (Covariance) Pair of Stocks 1 2 3 21% 30 25% 45 5 1 and 2 1 and 3 2 and 3 8 0.040 -0.005 -0.010 296 FIGURE 8.13 A spreadsheet model for the portfolio selection example of nonlinear programming, where the changing cells Portfolio (C14:E14 Range Name Solver Parameters Set Objective Cell: Variance To: Min By Changing Variable Cells: Portfolio Subject to the Constraints: Expected Return >= MinExpected Return Total = One Hundred Percent Solver Options: Make Variables Nonnegative Solving Method: GRG Nonlinear or Quadratic (Analytic Solver) Cells E F G H A | D B D9 1 Portfolio Selection Problem (Nonlinear Programming) Covar12 Covar13 E9 2 Covar23 E10 3 Stock 1 Stock 2 Stock 3 C9:E11 4 21% Covariance Expected Return 30% 8% 5 ExpectedReturn C19 6 Risk (Stand. Dev.) 25% 45% 5% E19 MinExpectedReturn 7 One HundredPercent H14 8 Joint Risk (Covar.) Stock 1 Stock 2 Stock 3 Portfolio C14:E14 9 Stock 1 0.040 -0.005 SD1 C6 10 Stock 2 -0.010 SD2 D6 11 Stock 3 SD3 12 E6 13 Stock Stock 2 Stock 3 Total StandDev C23 14 Portfolio 40.2% 21.7% Stock1 38.1% 100% = 100% C14 15 Stock2 D14 16 Minimum Stock3 17 E14 Expected 18 StockExpectedReturn C4:E4 Portfolio Return 19 Expected Return StockStandDev 18% C6:E6 20 18% Total F14 21 Risk (Variance) Variance 0.0238 C21 22 23 F 13 Total 14 B Risk (Stand. Dev.) 15.4% ESUM(Portfolio) 19 Expected Return =SUMPRODUCT(StockExpected Return Portfolio) 20 21 Risk (Variance) 22 23 Risk (Stand, Dev.) =SQRT(Variance) (SDI-Stock 1942)+(SD2* Stock2y^2)+(SD3* Stock3/2) +2*Covarl2Stockl * Stock2 +2"Covar 13+Stock 1*Stock3+2+Covar23*Stock2*Stocka 8.6. Reconsider the portfolio selection example, including its spreadsheet model in Figure 8.13, given in Section 8.2. Note in Table 8.2 that Stock 2 has the highest expected return and Stock 3 has by far the lowest. Nevertheless, the changing cells Portfolio (C14:E14) provide an optimal solution that calls for purchasing far more of Stock 3 than of Stock 2. Although pur- chasing so much of Stock 3 greatly reduces the risk of the port- folio, an aggressive investor may be unwilling to own so much of a stock with such a low expected return. For the sake of such an investor, add a constraint to the model that specifies that the percentage of Stock 3 in the portfolio can- not exceed the amount specified by the investor. Then compare the expected return and risk (standard deviation of the return) of the optimal portfolio with that in Figure 8.13 when the upper bound on the percentage of Stock 3 allowed in the portfolio is set at the following values. a. 20% b. 0% AS Generate a parameter analysis report using Analytic Solver to systematically try all the percentages at 5% intervals from 0% to 50%. C. TABLE 8.2 Data for the Stocks of the Portfolio Selection Example Stock Expected Return Risk (Standard Deviation) Joint Risk per Stock (Covariance) Pair of Stocks 1 2 3 21% 30 25% 45 5 1 and 2 1 and 3 2 and 3 8 0.040 -0.005 -0.010 296 FIGURE 8.13 A spreadsheet model for the portfolio selection example of nonlinear programming, where the changing cells Portfolio (C14:E14 Range Name Solver Parameters Set Objective Cell: Variance To: Min By Changing Variable Cells: Portfolio Subject to the Constraints: Expected Return >= MinExpected Return Total = One Hundred Percent Solver Options: Make Variables Nonnegative Solving Method: GRG Nonlinear or Quadratic (Analytic Solver) Cells E F G H A | D B D9 1 Portfolio Selection Problem (Nonlinear Programming) Covar12 Covar13 E9 2 Covar23 E10 3 Stock 1 Stock 2 Stock 3 C9:E11 4 21% Covariance Expected Return 30% 8% 5 ExpectedReturn C19 6 Risk (Stand. Dev.) 25% 45% 5% E19 MinExpectedReturn 7 One HundredPercent H14 8 Joint Risk (Covar.) Stock 1 Stock 2 Stock 3 Portfolio C14:E14 9 Stock 1 0.040 -0.005 SD1 C6 10 Stock 2 -0.010 SD2 D6 11 Stock 3 SD3 12 E6 13 Stock Stock 2 Stock 3 Total StandDev C23 14 Portfolio 40.2% 21.7% Stock1 38.1% 100% = 100% C14 15 Stock2 D14 16 Minimum Stock3 17 E14 Expected 18 StockExpectedReturn C4:E4 Portfolio Return 19 Expected Return StockStandDev 18% C6:E6 20 18% Total F14 21 Risk (Variance) Variance 0.0238 C21 22 23 F 13 Total 14 B Risk (Stand. Dev.) 15.4% ESUM(Portfolio) 19 Expected Return =SUMPRODUCT(StockExpected Return Portfolio) 20 21 Risk (Variance) 22 23 Risk (Stand, Dev.) =SQRT(Variance) (SDI-Stock 1942)+(SD2* Stock2y^2)+(SD3* Stock3/2) +2*Covarl2Stockl * Stock2 +2"Covar 13+Stock 1*Stock3+2+Covar23*Stock2*StockaStep by Step Solution
There are 3 Steps involved in it
Step: 1

Get Instant Access to Expert-Tailored Solutions
See step-by-step solutions with expert insights and AI powered tools for academic success
Step: 2

Step: 3
Ace Your Homework with AI
Get the answers you need in no time with our AI-driven, step-by-step assistance
Get Started
Auditing ISO Management System
Authors: Dr. RAMESH R LAKHE, Dr. RAKESH L. SHRIVASTAVA, M M NAVEED, KRANTI P DHARKAR, Dr. C M SEDANI
1st Edition
1702203913, 978-1702203913