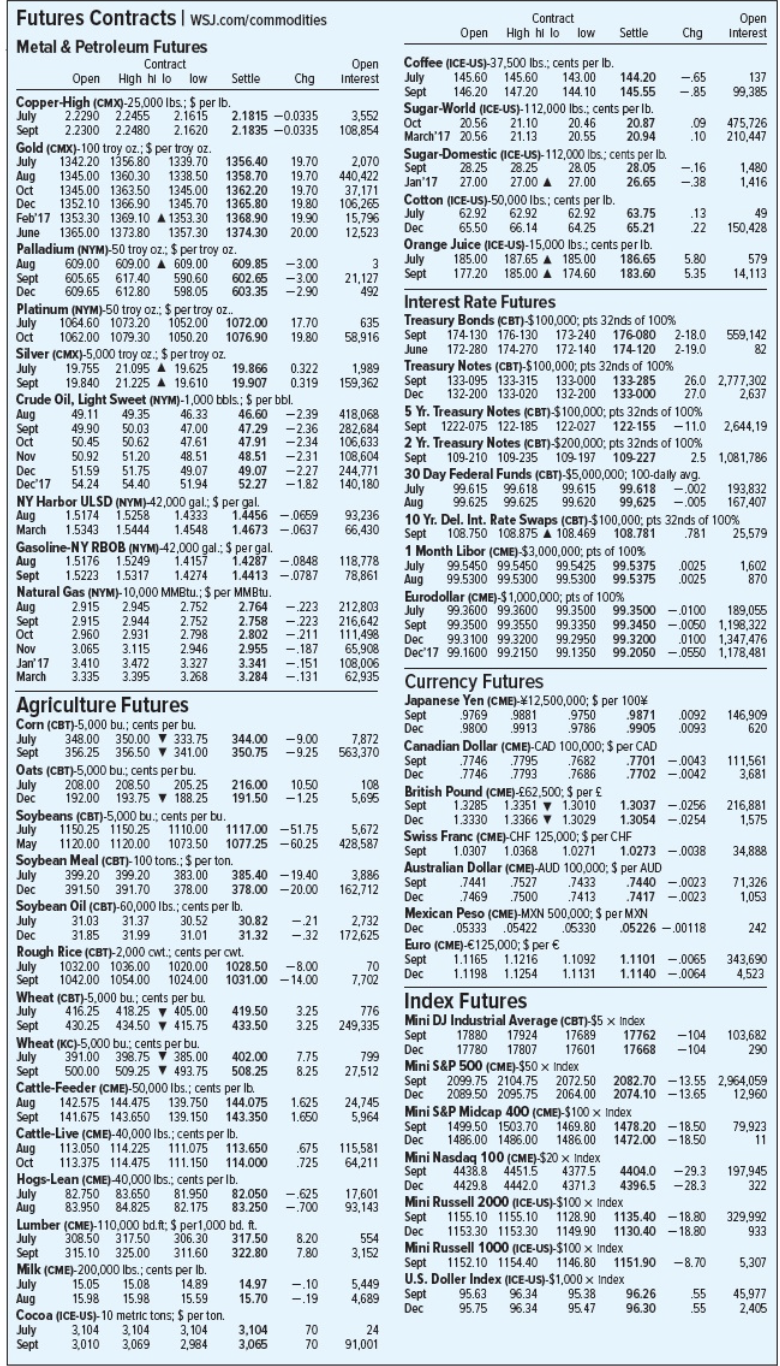
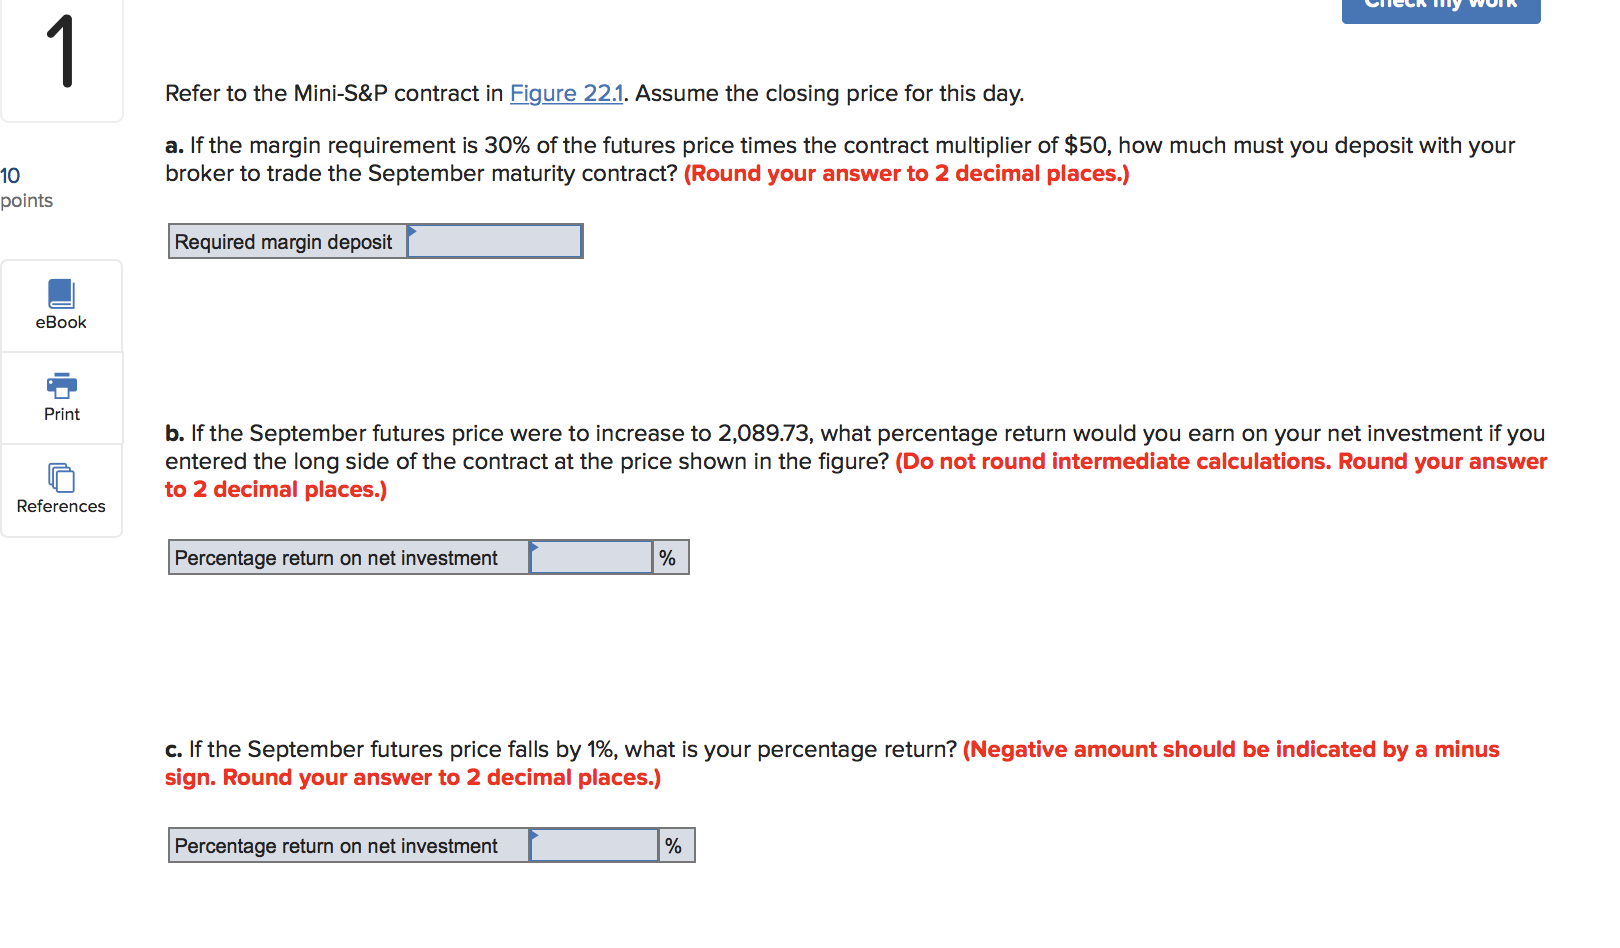
Open Contract High hilo low Settle Chg Open interest Open interest -65137 -.85 99,385 3,552 108,854 .09 10 475,726 210,447 Coffee (ICE-US)-37,500 lbs., cents per lb. July 145.60 145.60 143.00 144.20 Sept 146.20 147.20 144.10 145.55 Sugar-World (ICE-US)-112,000 lbs.: cents per lb. Oct 20.56 21.10 2 0.46 20.87 March 17 20.56 21.13 20.55 20.94 Sugar Domestic (ICE-US)-112,000 lbs.: cents per lb. Sept 28.25 28.25 28.05 28.05 Jan'17 27.00 27.00 A 27.00 26.65 Cotton (ICE-US)-50,000 lbs.; cents per lb. July 62.92 62.92 62.92 63.75 Dec 65.50 66.14 64.25 65.21 Orange Juice (ICE-US)-15,000 lbs., cents per lb. July 185.00 187.65 A 185.00 186.65 Sept 177.20 185.00 A 174.60 183.60 -.16 -38 2,070 440,422 37,171 106,265 15,796 12,523 1,480 1.416 49 22 150,428 5.80 5.35 579 14.113 21,127 492 635 58,916 Futures Contracts I WSJ.com/commodities Metal & Petroleum Futures Contract Open High hilo low Settle Chg Copper-High (CMX)-25,000 lbs: $ per lb. July 2.7290 2.2455 2.1615 2.1815 -0.0335 Sept 2.2300 2.2480 2.16202.1835 -0.0335 Gold (CMX)-100 troy oz: $ per trov oz July 1342.20 1356.801339.70 1356.40 19.70 Aug 1345.00 1360.30 1338.50 1358.70 19.70 Oct 1345.00 1363.50 1345.00 1362.20 19.70 Dec 1352.10 1366.90 1345.70 1365.80 19.80 Feb'17 1353.30 1369.10 A 1353.30 1368.90 1 9.90 June 1365.00 1373.80 1357.30 1374.30 20.00 Palladium (NYM)-50 troy oz: $ per troy oz. Aug 609.00 609.00 A 609.00 609.85 -3.00 Sept 605.65 617.40 590.60 602.65 -3.00 Dec 609.65 612.80 598.05 603.35 -2.90 Platinum (NYM)-50 troy oz.: $ per troy oz.. July 1064.60 1073.20 1052.00 1072.00 17.70 Oct 1062.00 1079.30 1050.20 1076.90 19.80 Silver (CMX)-5,000 troy oz.: $ per troy oz. July 19.755 21.095 A 19.625 19.866 0.322 Sept 19.840 21.225 A 19.610 19.907 0.319 Crude Oil, Light Sweet (NYM)-1.000 bols: $ per bbl. Aug 49.11 49.35 46.33 46.60 -2.39 Sept 49.90 50.03 47.00 47.29 -2.36 Oct 50.45 50.62 47.61 47.91 -2.34 Nov 50.92 51.20 48.51 4 8.51 -2.31 Dec 51.59 51.75 4 9.07 49.07 -2.27 Dec 17 54.24 54.40 51.94 52.27 -1.82 NY Harbor ULSD (NYM) 42,000 gal: $ per gal. Aug 1.5174 1.5258 1.4333 1.4456 - 0659 March 1.5343 1.5444 1.4548 1.4673 -0637 Gasoline-NY RBOB (NYM) 42,000 gal: $ per gal. Aug 1.5176 1.5249 1.4157 1.4287 -.0848 Sept 1.5223 1.53171.4274 1.4413 -.0787 Natural Gas (NYM)-10,000 MMBtu.: $ per MMBtu. Aug 2.915 2.945 2.752 2.764 - 223 Sept 2.915 2.944 2.752 2.758 -223 Oct 2.960 2.931 2.798 2.802 - 211 Nov 3.065 3.115 2.946 2.955 -.187 Jan'17 3.410 3.472 3.327 3.341 - 151 March 3.335 3.395 3.268 3.284 -131 1,989 159,362 418,068 282,684 106,633 108,604 244,771 140,180 Interest Rate Futures Treasury Bonds (CBT)-$100,000: pts 32nds of 100% Sept 174-130 176-130 173-240 176-080 2-18.0 559,142 June 172-280 174-270 172-140 174-1202-19.0 82 Treasury Notes (CBT)-$100,000; pts 32nds of 100% Sept 133-095 133-315 133-000 133-285 26.0 2,777,302 Dec 132-200 133-020 132-200 133-000 27.0 2,637 5 Yr. Treasury Notes (CBT) $100,000: pts 32nds of 100% Sept 1222-075 122-185122-027 122-155 -11.0 2,644,19 2 Yr. Treasury Notes (CBT) $200,000: pts 32nds of 100% Sept 109-210 109-235 109.197 109.227 2 .5 1,081,786 30 Day Federal Funds (CBT)-$5,000,000; 100-daily avg. July 99.615 99.618 99.615 99.618 -.002 193,832 Aug 99.625 99.625 99.620 99,625 -.005 167,407 10 Yr. Del. Int. Rate Swaps (CBT)-$100,000: pts 32nds of 100% Sept 108.750 108.875 108.469 108.781 781 25,579 1 Month Libor (CME) $3,000,000: pts of 100% July 99.5450 99.5450 99.5425 99.5375 .0025 1,602 Aug 99.5300 99.5300 99.5300 99.5375 .0025 870 Eurodollar (CME)-$1,000,000; pts of 100% July 99.3600 99.3600 99.3500 99.3500 -.0100 189.055 Sept 99.3500 99.3550 99.3350 99.3450 -.0050 1,198,322 Dec 99.3 100 99.3200 99.2950 99.3200 .0100 1,347,476 Dec'17 99.1600 99.2150 99.1350 99.2050 -0550 1,178,481 93,236 66,430 118,778 78,861 212,803 216,642 111,498 65,908 108,006 62,935 146,909 620 -9.00 -9.25 7,872 563,370 111,561 3,681 10.50 -1.25 108 5,695 216,881 1,575 -51.75 -60.25 5,672 428,587 Currency Futures Japanese Yen (CME)- 12,500,000: $ per 100% Sept .97699881 9 750 9871 .0092 Dec 9800 9913 9786 9 905 .0093 Canadian Dollar (CME)-CAD 100,000; $ per CAD Sept .7746 7795 7 682 .7701 -.0043 Dec 7746 7 793 7686 .7702 - 0042 British Pound (CME)62,500: $ per Sept 1.3285 1.3351 1.3010 1.3037 -0256 Dec 1.3330 1.3366 1.3029 1.3054 -.0254 Swiss Franc (CME)-CHF 125,000: $ per CHF Sept 1.0307 1.0368 1.0271 1.0273 -.0038 Australian Dollar (CME)-AUD 100,000: $ per AUD Sept .7441 7527 7433 .7440 -0023 Dec 746975007413 .7417 -0023 Mexican Peso (CME)-MXN 500,000: $ per MXN Dec 05333 05422 0533005226 - 00118 Euro (CME)-125,000: $ per Sept 1.1165 1.1216 1.1092 1.1101 -.0065 Dec 1.1198 1.1254 1.1131 1.1140 - 0064 34,888 -19.40 - 20.00 3.886 162,712 71,326 1,053 -21 -32 2,732 172,625 242 70 -8.00 - 14.00 343,690 4,523 7,702 Agriculture Futures Corn (CBT)-5,000 bu, cents per bu. July 348.00 350.00 333.75 344.00 Sept 356.25 356.50 341.00 350.75 Oats (CBT)-5,000 bu., cents per bu. July 208.00 208.50 205.25 216.00 Dec 192.00 193.75 188.25 191.50 Soybeans (CBT)-5,000 bu., cents per bu. July 1150.25 1150.25 1110.00 1117.00 May 1120.00 1120.00 1073.50 1077.25 Soybean Meal (CBT)-100 tons.: $ per ton. July 399.20 399.20 383.00 385.40 Dec 391.50 391.70 378.00 378.00 Soybean Oil (CBT)-60,000 lbs., cents per lb. July 31.03 31.37 30.52 30.82 Dec 31.85 31.99 31.01 31.32 Rough Rice (CBT)-2,000 cwt., cents per cwt. July 1032.00 1036.00 1020.00 1028.50 Sept 1042.00 1054.00 1024.00 1031.00 Wheat (CBT)-5.000 bu, cents per bu. July 416.25 418.25 405.00 419.50 Sept 430.25 434.50 415.75 433.50 Wheat (KC)-5,000 bu: cents per bu. July 391.00 398.75 V 385.00 402.00 Sept 500.00 509.25 V 493.75 508.25 Cattle-Feeder (CME)-50,000 lbs., cents per lb. Aug 142.575 144.475 139.750 144.075 Sept 141.675 143.650 139.150 143.350 Cattle-Live (CME)-40,000 lbs., cents per lb. Aug 113.050 114.225 111.075 113.650 Oct 113.375 114.475 111.150 114.000 Hogs-Lean (CME)-40,000 lbs.: cents per lb. July 82.750 83.650 81.950 82.050 Aug 83.950 84.825 82.175 83.250 Lumber (CME)-110,000 bd.ft: $ per 1.000 bd. ft. July 308.50 317.50 306.30 317.50 Sept 315.10 325.00 311.60 322.80 Milk (CME)-200,000 lbs., cents per lb. July 15.05 15.08 14.89 14.97 Aug 15.98 15.98 15.59 15.70 Cocoa (ICE-US)-10 metric tons: $ per ton. July 3,104 3.104 3,104 3,104 Sept 3,010 3,069 2,984 3,065 3.25 3.25 776 249,335 -104 -104 103,682 290 7.75 8.25 799 27,512 -13.55 -13.65 2,964,059 12,960 1.625 1.650 24,745 5,964 -18.50 -18.50 79,923 675 725 115,581 64,211 Index Futures Mini DJ Industrial Average (CBT)-$5 x Index Sept 17880 17924 17689 1 7762 Dec 17780 17807 17601 1 7668 Mini S&P 500 (CME)-$50 x Index Sept 2099.75 2104.75 2072.50 2082.70 Dec 2089.50 2095.75 2064.00 2074.10 Mini S&P Midcap 400 (CME)-$100 x Index Sept 1499.50 1503.70 1469.80 1478.20 Dec 1486.00 1486.00 1486.00 1472.00 Mini Nasdaq 100 (CME)-$20 x Index Sept 4438.8 4451.5 4377.5 4404.0 Dec 4429.8 4442.0 4371. 3 4396.5 Mini Russell 2000 (ICE-US)-$100 x Index Sept 1155.10 1155.10 1128.90 1135.40 Dec 1153.30 1153.30 1149.90 1130.40 Mini Russell 1000 (ICE-US) $100 x Index Sept 1152.10 1154.40 1146.80 1151.90 U.S. Doller Index (ICE-US)-$1.000 x Index Sept 95.63 96.34 95.38 96.26 Dec 95.75 96.34 95.47 96.30 -29.3 -28.3 197.945 322 -625 -700 17,601 93,143 -18.80 -18.80 329,992 933 554 3,152 7.80 -8.70 5,307 -.10 -.19 5,449 4,689 55 55 45,977 2.405 24 70 70 91,001 CUCU W WUI Refer to the Mini-S&P contract in Figure 22.1. Assume the closing price for this day. a. If the margin requirement is 30% of the futures price times the contract multiplier of $50, how much must you deposit with your broker to trade the September maturity contract? (Round your answer to 2 decimal places.) 10 points Required margin deposit eBook Print b. If the September futures price were to increase to 2,089.73, what percentage return would you earn on your net investment if you entered the long side of the contract at the price shown in the figure? (Do not round intermediate calculations. Round your answer to 2 decimal places.) References Percentage return on net investment c. If the September futures price falls by 1%, what is your percentage return? (Negative amount should be indicated by a minus sign. Round your answer to 2 decimal places.) Percentage return on net investment