Answered step by step
Verified Expert Solution
Link Copied!

Question

1 Approved Answer

Part 1 of 2 Use the data shown in the graph to write a quadratic regression equation. Then predict the box office revenue in Box
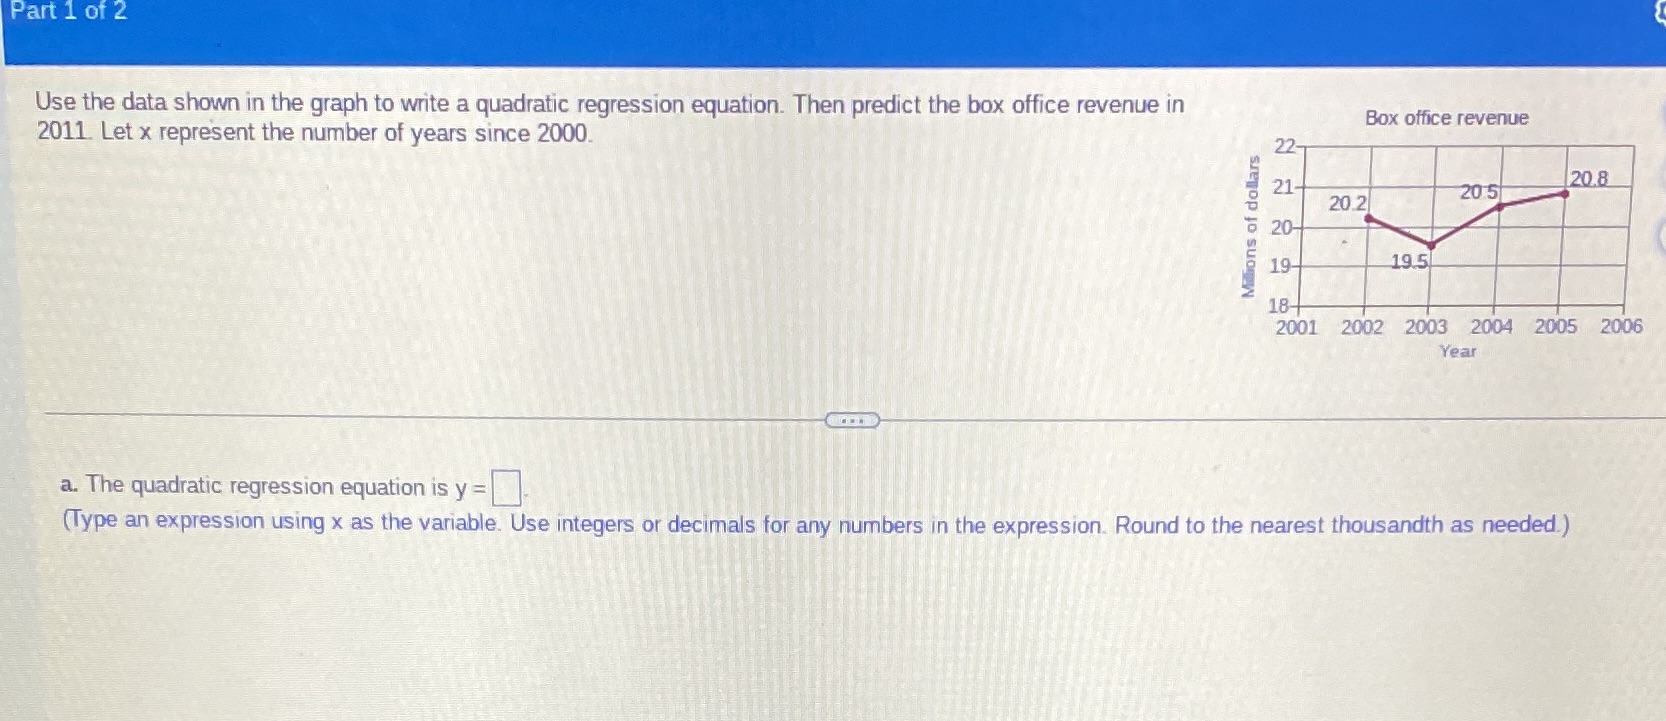
image text in transcribed
Part 1 of 2 Use the data shown in the graph to write a quadratic regression equation. Then predict the box office revenue in Box office revenue 2011 Let x represent the number of years since 2000. 22- 21 20.8 20.2 20 5 Millions of dollars 20- 19- 19.5 18 2001 2002 2003 2004 2005 2006 Year a. The quadratic regression equation is y = (Type an expression using x as the variable. Use integers or decimals for any numbers in the expression. Round to the nearest thousandth as needed.)

Step by Step Solution

There are 3 Steps involved in it

Step: 1

blur-text-image

Get Instant Access to Expert-Tailored Solutions

See step-by-step solutions with expert insights and AI powered tools for academic success

Step: 2

blur-text-image_2

Step: 3

blur-text-image_3

Ace Your Homework with AI

Get the answers you need in no time with our AI-driven, step-by-step assistance

Get Started

Recommended Textbook for

Intermediate Accounting

Authors: Donald E. Kieso, Jerry J. Weygandt, And Terry D. Warfield

13th Edition

9780470374948, 470423684, 470374942, 978-0470423684

Students also viewed these Mathematics questions

Question

How the Financial System Interfaces with the Economy

Answered: 1 week ago