Part I: Reporting in Action
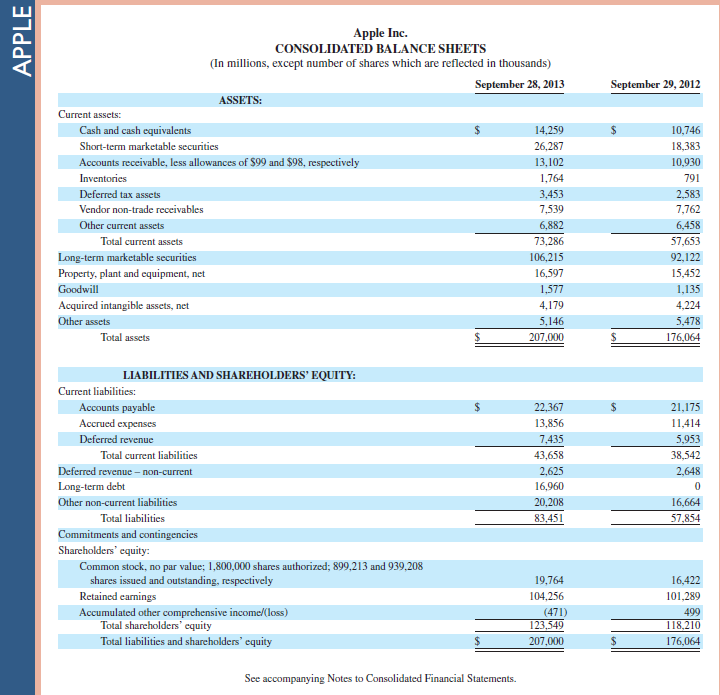
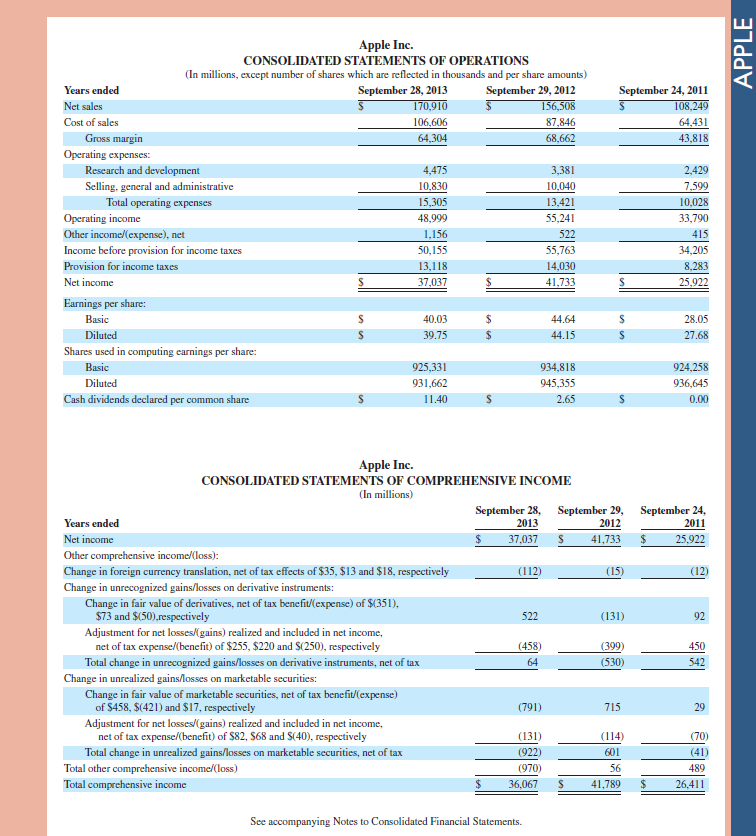
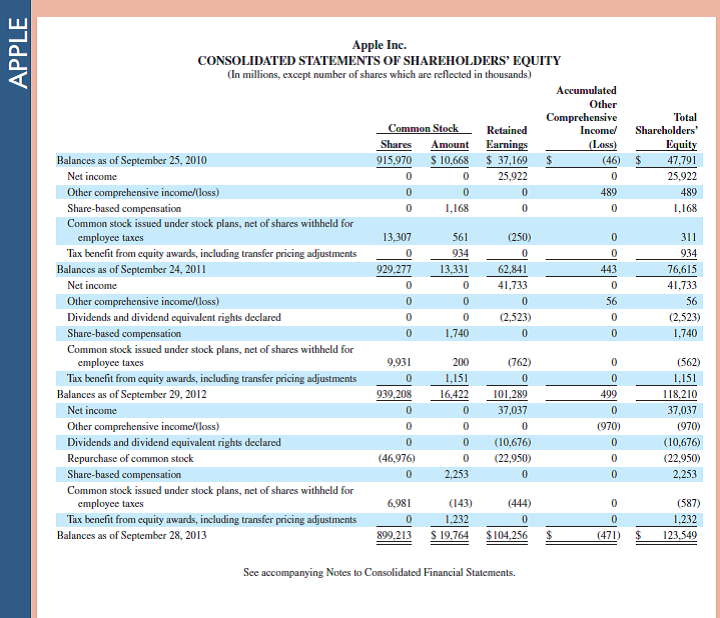
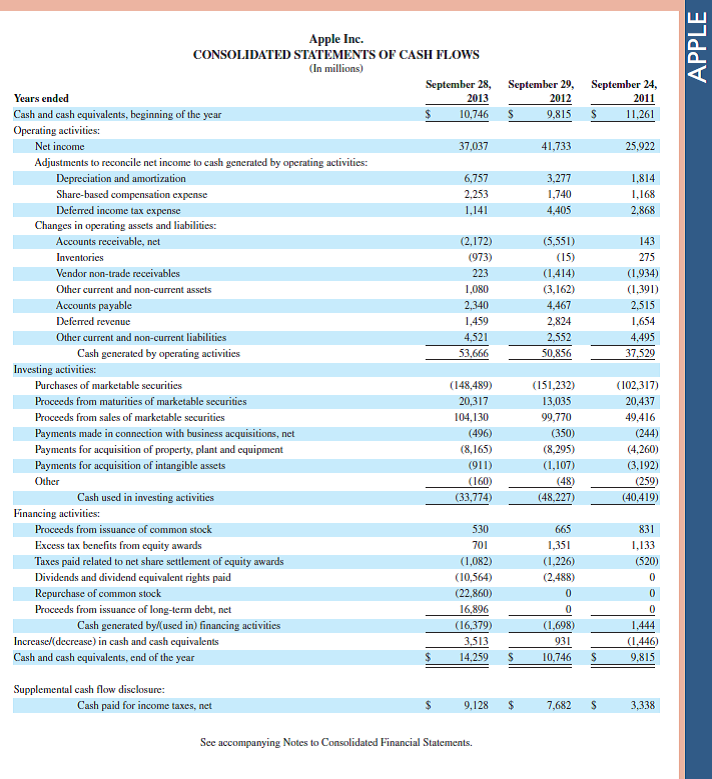
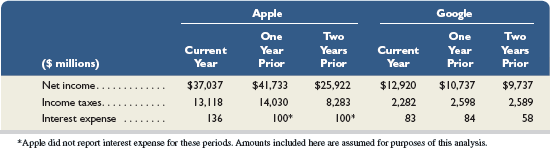
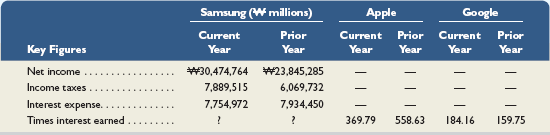
Apple Inc. APPLE CONSOLIDATED BALANCE SHEETS (In millions, except number of shares which are reflected in thousands) September 28, 2013 September 29, 2012 ASSETS: Current assets: Cash and cash equivalents 14.259 10,746 Short-term marketable securities 26,287 18,383 Accounts receivable, less allowances of $99 and $98, respectively 13,102 10,930 Inventories 1,764 791 Deferred tax assets 3,453 2,583 Vendor non-trade receivables 7,539 7,762 Other current assets 6,882 6,458 Total current assets 73,286 57,653 Long-term marketable securities 106,215 92, 122 Property, plant and equipment, net 16,597 15,452 Goodwill 1,577 1,135 Acquired intangible assets, net 4,179 4,224 Other assets 5,146 5,478 Total assets 207,000 176,064 LIABILITIES AND SHAREHOLDERS' EQUITY: Current liabilities: Accounts payable 22,367 21,175 Accrued expenses 13.856 11,414 Deferred revenue 7,435 5,953 Total current liabilities 43,658 38,542 Deferred revenue - non-current 2,625 2,648 Long-term debt 16,960 Other non-current liabilities 20,208 16,664 Total liabilities 83.451 57,854 Commitments and contingencies Shareholders' equity: Common stock, no par value; 1,800,000 shares authorized; 899,213 and 939,208 shares issued and outstanding, respectively 19,764 16,422 Retained earnings 104,256 101,289 Accumulated other comprehensive income/(loss) (471) 499 Total shareholders' equity 123,549 118,210 Total liabilities and shareholders' equity 207,000 176,064 See accompanying Notes to Consolidated Financial Statements.Apple Inc. APPLE CONSOLIDATED STATEMENTS OF OPERATIONS (In millions, except number of shares which are reflected in thousands and per share amounts) Years ended September 28, 2013 September 29, 2012 September 24, 2011 Net sales 170,910 156,508 108,249 Cost of sales 106,606 87,846 64.431 Gross margin 64.304 68,662 43,818 Operating expenses: Research and development 4.475 3,381 2,429 Selling, general and administrative 10,830 10,040 7,599 Total operating expenses 15,305 13,421 10,028 Operating income 48,999 55,24 33,790 Other income/(expense), net ,156 522 415 Income before provision for income taxes 50,15 55,763 34,205 Provision for income taxes 13,118 14,030 3,28. Net income 37,037 41,733 25,922 Earnings per share: Basic 40.03 44.64 28.05 Diluted 39.75 44.15 27.6 Shares used in computing earnings per share: Basic 925,331 934,818 924,258 Diluted 931,662 945,355 936,645 Cash dividends declared per common share S 11.40 S 2.65 S 0.00 Apple Inc. CONSOLIDATED STATEMENTS OF COMPREHENSIVE INCOME (In millions) September 28, September 29, September 24 Years ended 2013 2012 2011 Net income 37.037 41,733 25.922 Other comprehensive income/(loss): Change in foreign currency translation, net of tax effects of $35, $13 and $18, respectively (112) (15) (12) Change in unrecognized gains/losses on derivative instruments: Change in fair value of derivatives, net of tax benefit/(expense) of $(351), $73 and $(50), respectively 522 (131) Adjustment for net losses/(gains) realized and included in net income, net of tax expense/(benefit) of $255, $220 and $(250), respectively 458) (399) 450 Total change in unrecognized gains/losses on derivative instruments, net of tax 64 (530) 542 Change in unrealized gains/losses on marketable securities: Change in fair value of marketable securities, net of tax benefit/(expense) of $458, $(421) and $17, respectively (791) 715 29 Adjustment for net losses/(gains) realized and included in net income, net of tax expense/(benefit) of $82, $68 and $(40), respectively (131) (114) (70) Total change in unrealized gains/losses on marketable securities, net of tax (922) 601 (41) Total other comprehensive income/(loss) 970 56 489 Total comprehensive income 36.067 41,789 26.411 See accompanying Notes to Consolidated Financial Statements.Apple Inc. APPLE CONSOLIDATED STATEMENTS OF SHAREHOLDERS' EQUITY (In millions, except number of shares which are reflected in thousands) Accumulated Other Comprehensive Total Common Stock Retained Income/ Shareholders' Shares Amount Earnings (Loss) Equity Balances as of September 25, 2010 915.970 5 10.668 $ 37,169 $ (46) 47,791 Net income 25,922 0 25.922 Other comprehensive income/(loss) 0 0 489 489 Share-based compensation 1.168 0 1,168 Common stock issued under stock plans, net of shares withheld for employee taxes 13.307 561 (250) 0 311 Tax benefit from equity awards, including transfer pricing adjustments 934 934 Balances as of September 24, 201 1 929.277 13.331 62.841 143 76,615 Net income 0 41,733 0 41,733 Other comprehensive income/(loss) 0 0 56 56 Dividends and dividend equivalent rights declared (2,523) (2,523) Share-based compensation 1.740 1,740 Common stock issued under stock plans, net of shares withheld for employee taxes 9.931 200 (762) 0 (562) Tax benefit from equity awards, including transfer pricing adjustments 0 1,151 0 1,151 Balances as of September 29, 2012 939 208 16.422 101,289 190 118,210 Net income 0 37.037 37.037 Other comprehensive income/(loss) (970) (970) Dividends and dividend equivalent rights declared 0 (10,676) 0 (10,676) Repurchase of common stock (46.976) (22,950) (22,950) Share-based compensation 0 2.253 0 2.253 Common stock issued under stock plans, net of shares withheld for employee taxes 6,981 (143) (444) (587) Tax benefit from equity awards, including transfer pricing adjustments 0 1.232 1,232 Balances as of September 28, 2013 899.213 $ 19.764 $104,256 $ 471) 123.549 See accompanying Notes to Consolidated Financial Statements.Apple Inc. APPLE CONSOLIDATED STATEMENTS OF CASH FLOWS (In millions) September 28, September 29, September 24, Years ended 2013 2012 2011 Cash and cash equivalents, beginning of the year 10,746 9,815 S 11.261 Operating activities: Net income 37,037 41,733 25.922 Adjustments to reconcile net income to cash generated by operating activities: Depreciation and amortization 6,757 1,814 Share-based compensation expense 2,253 1,740 1,168 Deferred income tax expense 1,141 4,405 2.868 Changes in operating assets and liabilities: Accounts receivable, net (2,172) (5,551) 143 Inventories (973) (15) 275 Vendor non-trade receivables 223 (1,414) (1.934) Other current and non-current assets 1,080 (3,162) (1.391) Accounts payable 2,340 4,467 2,515 Deferred revenue 1,459 2,824 1,654 Other current and non-current liabilities 4.521 2,552 4.495 Cash generated by operating activities 53.666 50.856 37.529 Investing activities: Purchases of marketable securities (148,489) (151,232) (102.317) Proceeds from maturities of marketable securities 20,317 13.035 20,437 Proceeds from sales of marketable securities 104,130 99,770 49,416 Payments made in connection with business acquisitions, net (496) (350) (244) Payments for acquisition of property, plant and equipment (8,165) (8,295) (4.260) Payments for acquisition of intangible assets (91 1) (1,107) (3.192) Other (160) (48) (259) Cash used in investing activities 33,774) (48,227) (40.419) Financing activities: Proceeds from issuance of common stock 530 665 831 Excess tax benefits from equity awards 701 1,351 1,133 Taxes paid related to net share settlement of equity awards (1,082) (1,226) (520) Dividends and dividend equivalent rights paid (10,564) (2,488) 0 Repurchase of common stock (22,860) 0 Proceeds from issuance of long-term debt, net 16,896 Cash generated by/(used in) financing activities (16.379) (1,698) 1.444 Increase/(decrease) in cash and cash equivalents 3,513 931 (1.446) Cash and cash equivalents, end of the year 14,259 10,746 9.815 Supplemental cash flow disclosure: Cash paid for income taxes, net $ 9,128 $ 7,682 S 3.338 See accompanying Notes to Consolidated Financial Statements.\fG\f\fSamsung (W millions) Apple Google Current Prior Current Prior Current Prior Key Figures Year Year Year Year Year Year Net income . . . . 430,474,764 W/23.845.285 Income taxes . . . 7,889,515 6.069.732 Interest expense. . .. 7,754.972 7.934.450 Times interest earned . . . . . 369.79 558.63 184.16 159.75Apple Google One Two One Two Current Year Years Current Year Years ($ millions) Year Prior Prior Year Prior Prior Net income. . . . . $37.037 $41,733 $25.922 $ 12,920 $10,737 $9.737 Income taxes. . . 13,1 18 14,030 8.283 2,282 2,598 2,589 Interest expense . . . . 136 100+ 100+ 83 84 58G\fG\fApple Google One Two One Two Current Year Years Current Year Years ($ millions) Year Prior Prior Year Prior Prior Net income. . . . . $37.037 $41,733 $25.922 $ 12,920 $10,737 $9.737 Income taxes. . . 13,1 18 14,030 8.283 2,282 2,598 2,589 Interest expense . . . . 136 100+ 100+ 83 84 58\f\fSamsung (W millions) Apple Google Current Prior Current Prior Current Prior Key Figures Year Year Year Year Year Year Net income . . . . 430,474,764 W/23.845.285 Income taxes . . . 7,889,515 6.069.732 Interest expense. . .. 7,754.972 7.934.450 Times interest earned . . . . . 369.79 558.63 184.16 159.75