

Question
PartB: Module III - Regression] [Concert Nation] Concert Nation, INC. is a nationwide promoter of rock concerts. The president of the company wants to develop
PartB: Module III - Regression]
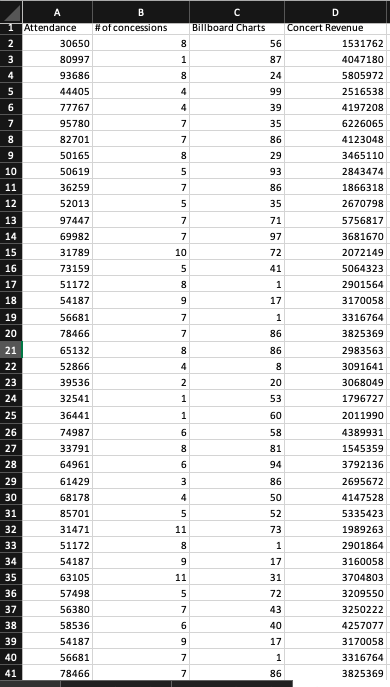
[Concert Nation]Concert Nation, INC. is a nationwide promoter of rock concerts. The president of the company wants to develop a model to estimate the revenue of a major concert event at large venues (such as Ford Field, Madison Square Gardens) for planning marketing strategies. The company has collected revenue data of 41 recent large concert events. For each concert, they have also recorded the attendance, the number of concession stands in the venue, and the Billboard chart of the artist in the week of each event. This data is available in "Part B - Data Set for Assessment Assignment.xlsx".They have two potential models that could explain the revenue. The two competing models are:
Model A: ??????? = ?0? + ?1??????????? + ??
Model B: ??????? = ?0? + ?1?????????? + ??
Run regression on both models. Use only the regression outputs of the two models and the original data to answer questions 14 to 20 below.
14. [2 pt] Let's consider the model A first. Which of the following statement is correct?
(a)The p-value of F-test is 221.64. Thus, the model does not significantly explain the revenue.
(b)The p-value of F-test is close to zero. This means that the independent variable in the regression significantly explains the revenue.
(c)The regression degrees of freedom is 40 in this regression model.
(d)Low p-value of F-test indicates weak evidence of a linear relationship.
15. [2 pt] Which of the following best interprets the coefficients in Model A?
(a)For each additional increase in attendance, the revenue of the concert increases on average by $57.12.
(b)The p-value of attendance variable is less than 0.01. There is not enough evidence to infer that there is a linear relationship between attendance and revenue.
(c)The intercept is -$6,225.48, which means one would lose money unless attendance is considered in the regression.
(d)The t-stat of intercept is -0.0259. Therefore, there is sufficient evidence to support that intercept is significantly different than zero.
16.[2 pt] If we use model A for prediction, what is the point estimate for the revenue of a concert that has an attendance of 35,000 people?
Point estimate:
17 [2 pt] What is an approximate 95% prediction interval for the concert revenue listed in the previous question?
Approximate 95% prediction interval:
18[2 pt] Did regression model A provide a good fit? Select the statement that best answers the question. (a) Yes, because we can reject the null hypothesis that ?1? is greater than zero.
a.No, because the standard error of the regression is too high.
b.Yes, because the model can explain 85% of the variability in revenue.
c.No, because the intercept of the regression is negative.
19. [2 pt] Compute the sample correlation coefficient between revenue and rank on Billboard chart using the regression output of Model B?
Sample correlation coefficient: ____________________
20 [2 pt] Which of the following statement is correct about Model B?
(a)The p-value of independent variable is 0.40. This indicates that the position of Billboard Chart is not a significant predictor of the revenue.
(b)The estimated slope of Billboard Chart is -$4,795.26. This means that keeping everything else constant, concert by an artist who was featured in Billboard chart recorded $4,795 less in revenue compared to who was not featured in Billboard chart.
(c)The p-value of F-test of this regression model is 0.70. Thus, the model shows a strong linear relationship.
(d)The t-statistic associated with Billboard Chart variable is 10.42. This means we can reject the null hypothesis and conclude that the coefficient of
Step by Step Solution
There are 3 Steps involved in it
Step: 1

Get Instant Access to Expert-Tailored Solutions
See step-by-step solutions with expert insights and AI powered tools for academic success
Step: 2

Step: 3
Ace Your Homework with AI
Get the answers you need in no time with our AI-driven, step-by-step assistance
Get Started
Accounting Information Systems
Authors: Jr Ulric J Gelinas, Ulric J Gelinas, Richard B Dull
8th Edition
0324663803, 9780324663808