Question
Percentiles and Quartiles: (Week 1 Notes Part 3, Slides 2 thru 7, 27) 25. What does it mean when a height of a boy in
Percentiles and Quartiles: (Week 1 Notes Part 3, Slides 2 thru 7, 27)
25. What does it mean when a height of a boy in the fifth grader is at the 90th percentile?
26.
I.The first quartile, Q1 is equivalent to the __________percentile
II.The second quartile, Q2 is equivalent to the __________percentile (The second quartile, Q2, is represented by the median)
III.The third quartile, Q3 is equivalent to the __________percentile
27. The difference between the third quartile and the first quartile (Q3 - Q1) is known as the _________________ range (IQR).
28. The ____________percent of data is included between the first quartile, Q1, and the third quartile, Q3
29. The Interquartile Range (IQR) can be used to measure the _______________ in a data
30.The measures of ________and _____________ are used to numerically summarize the data.
Five Number Summary of data (Week 1 Notes, Part 3, Slides 16-17)
31. List the numbers used for the 5-number summary of data
1.4.3 Robust Estimates: (Descriptive Stats with Minitab)
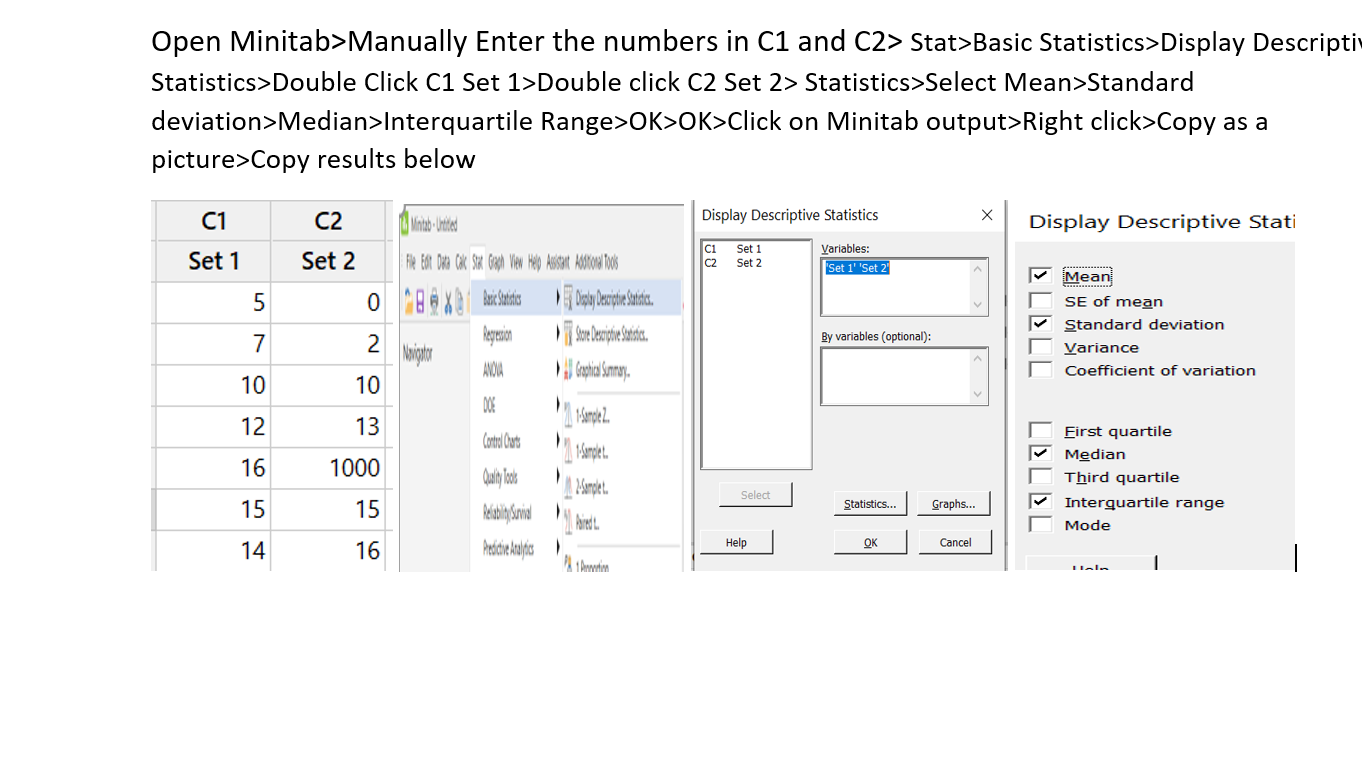
32. With Minitab, calculate the mean, the median, the standard deviation (SD) and interquartile range (IQR) for the datasets 1 and 2:
Dataset 1: 5, 7, 10, 12, 16, 15, 14
Dataset 2: 0, 2, 10, 13, 1000, 15, 16 (Notice the presence of the extreme values)
33.Compare the values of the Mean, Median, Standard deviation, and Interquartile Range
Notice?
I.There is a significant change in the values of the _____________and the _________ __________ from dataset 1 to dataset 2
II.There is not a significant change in the values of the _____________and the _________ __________ from dataset 1 to dataset 2
34. The median and the Interquartile Range (IQR) are considered the ______________estimates because extreme observations have little effect on their values.
Robust Estimates---Summarizing Symmetric vs Skewed Data
(Week 1 Notes, (part 3) Slides 12-14)
35. For Symmetric Distributions, it is often more appropriate to use the _______and the _________ ________________to describe the center and the spread
36. For Skewed Distributions, it is often more appropriate to use the _______and the _________ ________________to describe the center and the spread
************
1.4.4 Visualizing Distributions of Data: Histograms and Boxplots
37. Graphs show important features of data such as ____________or ____________ _________ that are not evident from numerical summaries.
The Histogram:
38. In a histogram the observations are grouped into________and plotted as _____. The bars in the histograms are _______________. (separated or connected)
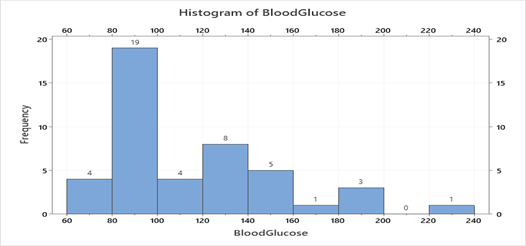
39. Consider the histogram of blood glucose levels for 45 individuals below:
40. The heights of the bars of the histogram, refer to the frequency, or the count of the individuals in the specific range of the blood glucose level, for example, there are 4 individuals who have blood glucose level between 60 to 80.
I.How many individuals have blood glucose level between 80 to 100?
II.How many individuals have blood glucose level between 180 to 200?
III.How many individuals have blood glucose level below 100?
IV.How many individuals have blood glucose level higher than140?
Describing the shapes of the distribution:
41.
I.A distribution is considered symmetric when the tails of the distribution are roughly ___________, with data trailing off the from the _______ roughly equally in both directions.
II.A distribution is considered right skewed when the data trail off to the __________
III.A distribution is considered left skewed when the data trail off to the __________


Step by Step Solution
There are 3 Steps involved in it
Step: 1

Get Instant Access to Expert-Tailored Solutions
See step-by-step solutions with expert insights and AI powered tools for academic success
Step: 2

Step: 3

Ace Your Homework with AI
Get the answers you need in no time with our AI-driven, step-by-step assistance
Get Started


