

Answered step by step
Verified Expert Solution
Question
1 Approved Answer
Perform vertical analysis of the data in the previous table to indicate any potential red flags regarding possible understatement of the COGS. begin{tabular}{l|r|r|r|r|r|} multicolumn{7}{c}{} &
Perform vertical analysis of the data in the previous table to indicate any potential red flags regarding possible understatement of the COGS. 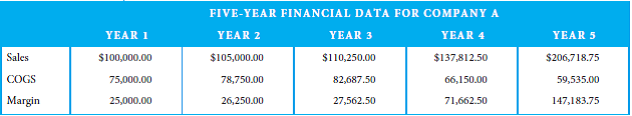
Step by Step Solution
There are 3 Steps involved in it
Step: 1

Get Instant Access to Expert-Tailored Solutions
See step-by-step solutions with expert insights and AI powered tools for academic success
Step: 2

Step: 3
Ace Your Homework with AI
Get the answers you need in no time with our AI-driven, step-by-step assistance
Get Started
Auditing Advances In Behavioral Research
Authors: Lawrence A. Ponemon, David R.L. Gabhart
1st Edition
0387976191, 978-0387976198