Answered step by step
Verified Expert Solution
Question
1 Approved Answer
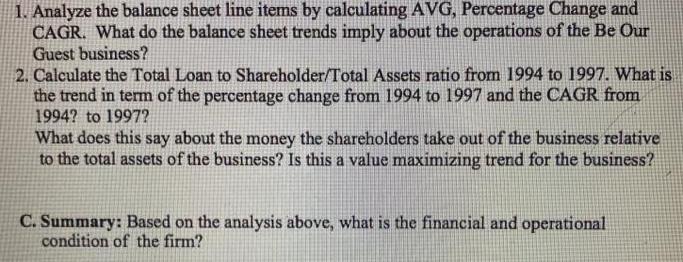
1. Analyze the balance sheet line items by calculating AVG, Percentage Change and CAGR. What do the balance sheet trends imply about the operations


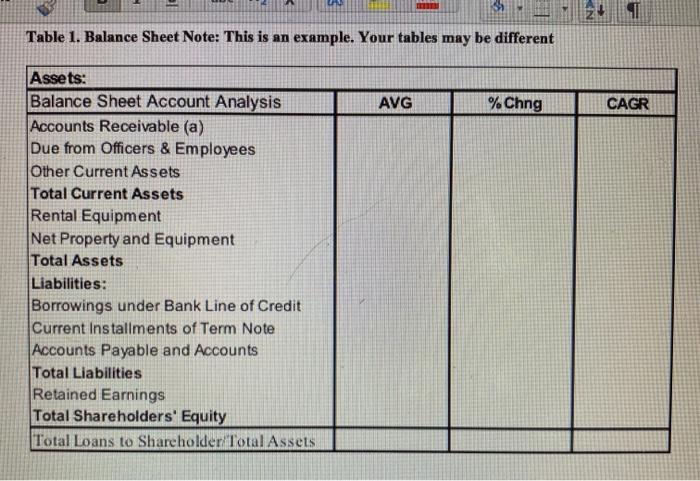
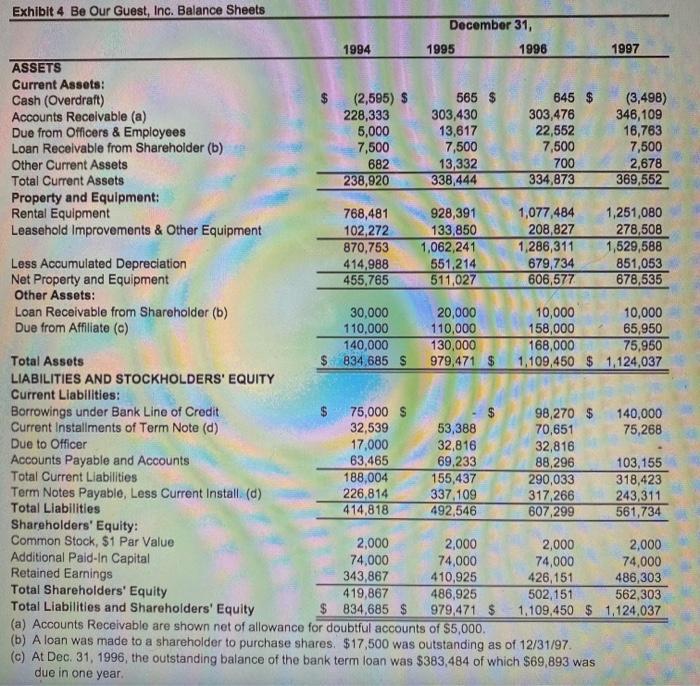
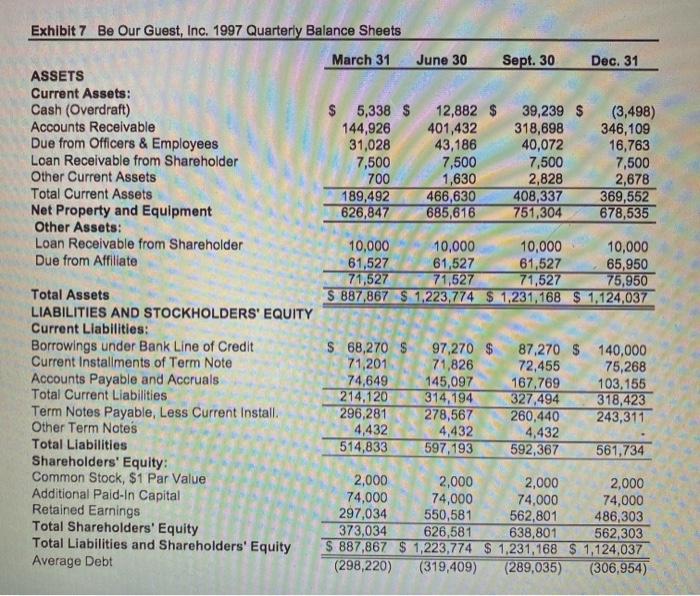
1. Analyze the balance sheet line items by calculating AVG, Percentage Change and CAGR. What do the balance sheet trends imply about the operations of the Be Our Guest business? 2. Calculate the Total Loan to Shareholder/Total Assets ratio from 1994 to 1997. What is the trend in term of the percentage change from 1994 to 1997 and the CAGR from 1994? to 1997? What does this say about the money the shareholders take out of the business relative to the total assets of the business? Is this a value maximizing trend for the business? C. Summary: Based on the analysis above, what is the financial and operational condition of the firm? Table 1. Balance Sheet Note: This is an example. Your tables may be different Assets: Balance Sheet Account Analysis Accounts Receivable (a) Due from Officers & Employees Other Current Assets Total Current Assets Rental Equipment Net Property and Equipment Total Assets Liabilities: Borrowings under Bank Line of Credit Current Installments of Term Note Accounts Payable and Accounts Total Liabilities Retained Earnings Total Shareholders' Equity Total Loans to Shareholder/Total Assets AVG % Chng N> CAGR Exhibit 4 Be Our Guest, Inc. Balance Sheets ASSETS Current Assets: Cash (Overdraft) Accounts Receivable (a) Due from Officers & Employees Loan Receivable from Shareholder (b) Other Current Assets Total Current Assets Property and Equipment: Rental Equipment Leasehold Improvements & Other Equipment Less Accumulated Depreciation Net Property and Equipment Other Assets: Loan Receivable from Shareholder (b) Due from Affiliate (c) Total Assets LIABILITIES AND STOCKHOLDERS' EQUITY Current Liabilities: Borrowings under Bank Line of Credit Current Installments of Term Note (d) Due to Officer Accounts Payable and Accounts Total Current Liabilities Term Notes Payable, Less Current Install (d) Total Liabilities Shareholders' Equity: Common Stock, $1 Par Value 1994 $ (2,595) $ 228,333 5,000 7,500 682 238,920 768,481 102,272 870,753 414,988 455,765 30,000 110,000 140,000 $834,685 S 75,000 $ 32,539 17,000 63,465 188,004 226,814 414,818 2,000 74,000 343,867 419,867 $ 834,685 $ December 31, 1995 565 $ 303,430 13,617 7,500 13,332 338,444 928,391 133,850 1,062,241 551,214 511,027 20,000 110,000 130,000 979,471 $ 53,388 32,816 69,233 155,437 337,109 492,546 2,000 74,000 410,925 1996 486,925 979,471 $ 645 $ 303,476 22,552 7,500 700 334,873 1,077,484 208,827 1,286,311 679,734 606,577 98,270 $ 70,651 32,816 88,296 290,033 317,266 607,299 1997 Additional Paid-In Capital Retained Earnings Total Shareholders' Equity Total Liabilities and Shareholders' Equity (a) Accounts Receivable are shown net of allowance for doubtful accounts of $5,000. (b) A loan was made to a shareholder to purchase shares. $17,500 was outstanding as of 12/31/97. (c) At Dec. 31, 1996, the outstanding balance of the bank term loan was $383,484 of which $69,893 was due in one year. (3,498) 10,000 10,000 158,000 65,950 168,000 75,950 1,109,450 $ 1,124,037 346,109 16,763 7,500 2,678 369,552 1,251,080 278,508 1,529,588 851,053 678,535 140,000 75,268 103,155 318,423 243,311 561,734 2,000 2,000 74,000 74,000 426,151 486,303 502,151 562,303 1,109,450 $ 1,124.037 Exhibit 7 Be Our Guest, Inc. 1997 Quarterly Balance Sheets March 31 ASSETS Current Assets: Cash (Overdraft) Accounts Receivable Due from Officers & Employees Loan Receivable from Shareholder Other Current Assets Total Current Assets Net Property and Equipment Other Assets: Loan Receivable from Shareholder Due from Affiliate Total Assets LIABILITIES AND STOCKHOLDERS' EQUITY Current Liabilities: Borrowings under Bank Line of Credit Current Installments of Term Note Accounts Payable and Accruals Total Current Liabilities Term Notes Payable, Less Current Install. Other Term Notes Total Liabilities Shareholders' Equity: Common Stock, $1 Par Value Additional Paid-In Capital Retained Earnings Total Shareholders' Equity Total Liabilities and Shareholders' Equity Average Debt $ 5,338 S 12,882 $ 401,432 43,186 144,926 31,028 7,500 700 189,492 626,847 10,000 61,527 71,527 June 30 71,201 74,649 214,120 296,281 4,432 514,833 7,500 1,630 2,000 74,000 297,034 466,630 685,616 S 68,270 S 97,270 $ 71,826 10,000 61,527 71,527 145,097 314,194 278,567 4,432 597,193 Sept. 30 2,000 74,000 550,581 626,581 39,239 S 318,698 40,072 10,000 65,950 75,950 S887,867 $1,223,774 $1,231,168 $ 1,124,037 7,500 2,828 408,337 751,304 10,000 61,527 71,527 Dec. 31 (3,498) 346,109 16,763 7,500 2,678 2,000 74,000 562,801 638,801 369,552 678,535 87,270 $ 140,000 72,455 75,268 167,769 103,155 327,494 318,423 260,440 243,311 4,432 592,367 561,734 2,000 74,000 486,303 373,034 562,303 S 887,867 $1,223,774 $1,231,168 $ 1,124,037 (298,220) (319,409) (289,035) (306,954)
Step by Step Solution
★★★★★
3.41 Rating (151 Votes )
There are 3 Steps involved in it
Step: 1
Assets Balance Sheet Account Analysis Accounts Receivables ...
Get Instant Access to Expert-Tailored Solutions
See step-by-step solutions with expert insights and AI powered tools for academic success
Step: 2

Step: 3

Ace Your Homework with AI
Get the answers you need in no time with our AI-driven, step-by-step assistance
Get Started


