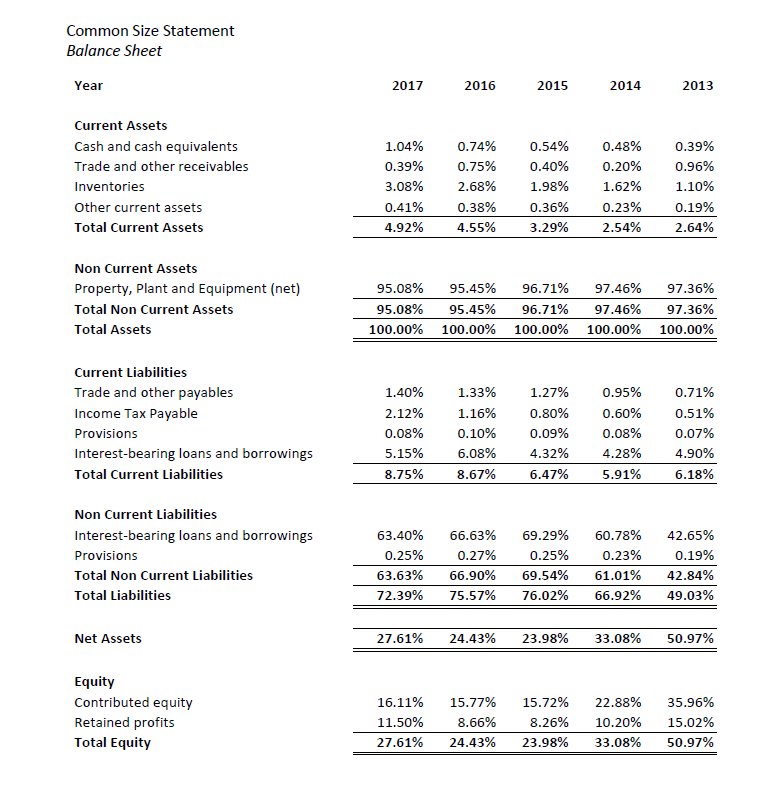
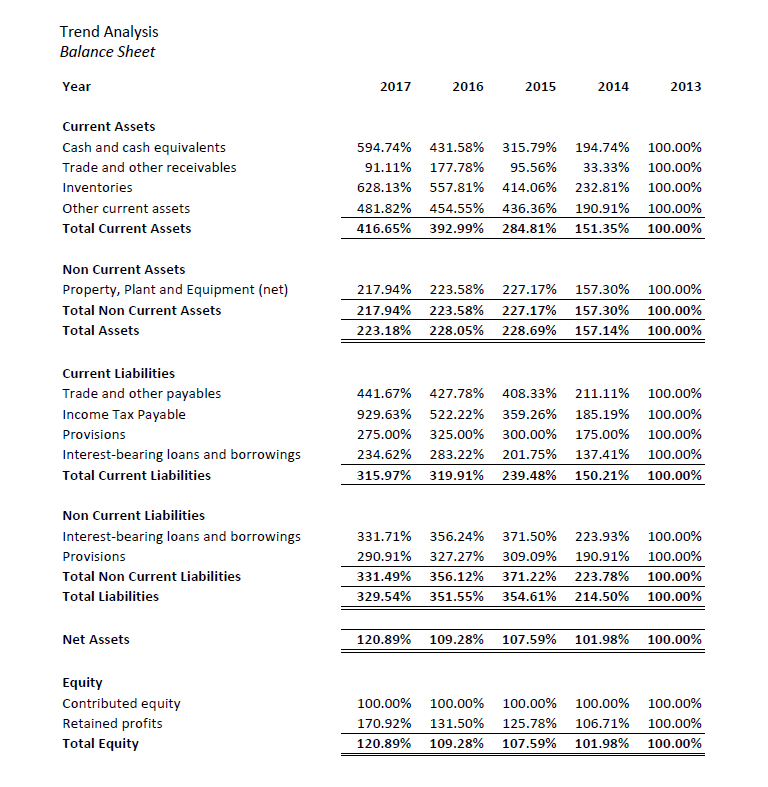
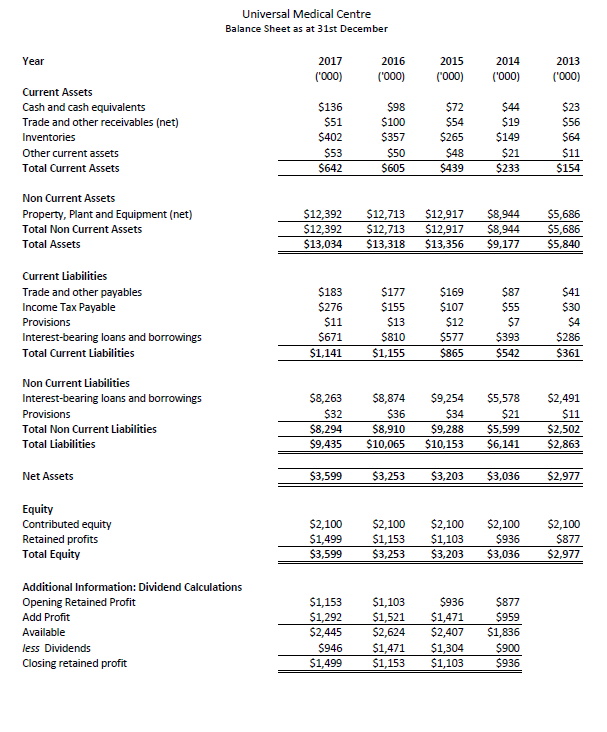
Please analyze the balance sheet attached below. *not interpret.
Common Size Statement Balance Sheet Year Current Assets Cash and cash equivalents Trade and other receivables Inventories Clther current assets Total Current Assets Non Current Assets Property, Plant and Equipment {net} Total Non Current Assets Total Assets Current Liabilities Trade and other payables lnoome Tax Payable ProyTsions Interest-bearing loans and borrowings Total Current Liabilities Non Current Liabilities Interest-bearing loans and borrowings Provisions Total Non Current Liabilities Total Liabilities Net Assets Equity Contributed equity Retained profits Total Equity 2012 1.04% 0.33% 3.03% 0.41% 4.92% 95.03% 95.03% 100.00% 1.40% 2.12% 0.03% 5.15% 3.25% 63.40% 0.25% 63.63% 22.39% 22.61% 16.11% 11.50% 22.61% 2016 0.24% 0.25% 2.63% 0.33% 4.55% 95.45% 95.45% 100.00% 1.33% 1.16% 0.10% 6.03% 3.62% 66.63% 0.22% 66.90% 25.52% 24.43% 15.22% 3.66% 24.43% 2015 0.54% 0.40% 1.93% 0.36% 3.29% 96.21% 96.21% 100.00% 1.22% 0.30% 0.09% 4.32% 6.42% 69.29% 0.25% 69.54% 26.02% 23.93% 15.22% 3.26% 23.93% 2014 0.43% 0.20% 1.62% 0.23% 2.54% 92.46% 92.46% 100.00% 0.95% 0.60% 0.03% 4.23% 5.91% 60.23% 0.23% 61.01% 66.92% 33.03% 22.33% 10.20% 33.03% 2013 0.39% 0.9 6% 1.10% 0.19% 2.64% 92.36% 92.36% 100.00% 0.21% 0.51% 0.02% 4.90% 6.13% 42.65% 0.19% 42.34% 49.03% 50.92% 35.9 6% 15.0 2% 50.92% Trend Analysis Balance Sheet Year 2012 2015 2015 2014 2013 Current Assets Cash and cash equivalents 594.24% 431.53% 315.29% 194.24% 100.00% Trade and other receivables 91.11% 122.23% 95.55% 33.33% 100.00% Inventories 523.13% 552.31% 414.05% 232.31% 100.00% Other current assets 431.32% 454.55% 435.35% 190.91% 100.00% Total Current Assets 415.55% 392.99% 234.31% 151.35% 100.00% Non Current Assets Property, Plant and Equipment {net} 212.94% 223.53% 222.12% 152.30% 100.00% Total Non Current Assets 212.94% 223.53% 222.12% 152.30% 100.00% Total Assets 223.13% 223.05% 223.59% 152.14% 100.00% Current liabilities Trade and other payables 441.52% 422.23% 403.33% 211.11% 100.00% lnoome Tax Pa 'jl'a ble 929.53% 522.22% 359.25% 135.19% 100.00% Provisions 225.00% 325.00% 300.00% 125.00% 100.00% Interestbearing loans and borrowings 234.52% 233.22% 201.25% 132.41% 100.00% Total Current Liabilities 315.92% 319.91% 239.43% 150.21% 100.00% Non Current Liabilities Interestbearing loans and borrowings 331.21% 355.24% 321.50% 223.93% 100.00% Provisions 290.91% 322.22% 309.09% 190.91% 100.00% Total Non Current liabilities 331.49% 355.12% 321.22% 223.23% 100.00% Total Liabilities 329.54% 351.55% 354.51% 214.50% 100.00% Net Assets 120.39% 109.23% 102.59% 101.93% 100.00% Equity Contributed equity 100.00% 100.00% 100.00% 100.00% 100.00% Retained profits 120.92% 131.50% 125.23% 105.21% 100.00% Total IEr:|uit'vl|r 120.39% 109.23% 102.59% 101.93% 100.00% ll'ear CtlTerIt Assets Cash and ash equivalents Trade and other receivabla [netl lnventoria El'tl'Ier current assets Total current Assets I'll-on Current Assets Property, Plant and Equipment [net] Total Non Current Assets Total Assets Cutent ljab'i ities Trade and other payabl Income Tax Payable Provisions lnterEtbean'ng loans and borrowings Total Cut-ant Liah'd ities I'll-on Current Liabilities lnteratbean'ng loans in! borrowings Provisions Total Non Current Liabilities Total Lialpi ities HetAssets Equity Cmuibuted equity Remirieol prots Total Equity Universal Medial Centre Balance Sheet as at am December 201?" [TIKH $135 551 $402 553 55a: 512,592 512.392 513.031 $133 $2?5 511 55:1 $1541 Sazas 532 $8394 $9335 $3599 $2500 $1399 $3599 Addiu'onal lnfonnau'on: Dividend Calculations Opening Retained Prot Add Prot Available Tess Dividends Closing retained prot 51553 $1592 sagas 51399 2015 {TIME 5'93 5100 $35? 550 5605 512313 $12313 513313 51?? $155 513 5310 51.155 SBTd 50.510 510.065 53.153 Sagan 51553 53253 s1sas SL521 $2524 51331 51,153 1015 TODD! $1131? slasJ? Susass 5159 510? 512 55?? 59254 59.203 510.153 53.203 52400 stoop $3.203 5935 Staal 5ZADT 51304 5111a 5aL141 2015 55,636 55.536 55.300 541 $236 $301 52391 511 also: 52353 523?? 52500 53?? 52.917