please answer question 4-10
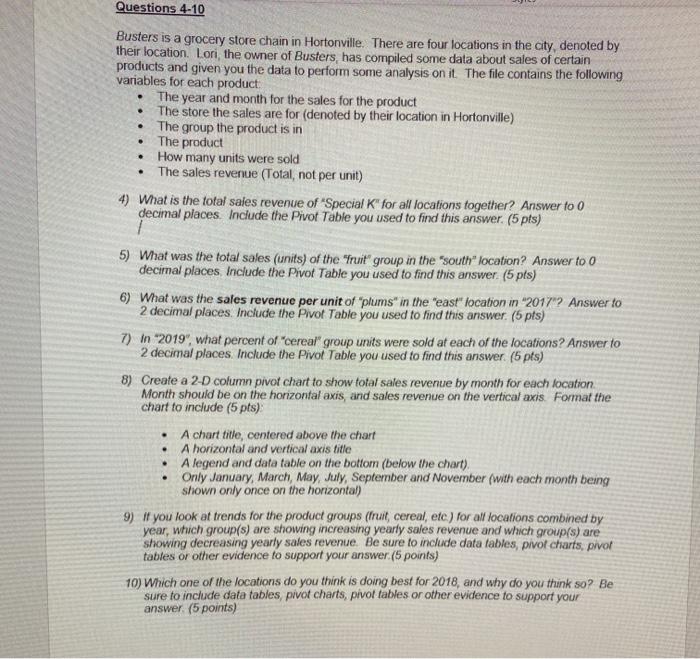
Questions 4-10 Busters is a grocery store chain in Hortonville. There are four locations in the city, denoted by their location. Lori the owner of Busters, has compiled some data about sales of certain products and given you the data to perform some analysis on it. The file contains the following variables for each product The year and month for the sales for the product The store the sales are for (denoted by their location in Hortonville) The group the product is in The product How many units were sold The sales revenue (Total, not per unit) 4) What is the total sales revenue of Special K" for all locations together? Answer to 0 decimal places include the Pivot Table you used to find this answer. (5 pts) . . 5) What was the total sales (units) of the "fruit" group in the south" location? Answer to 0 decimal places include the Pivot Table you used to find this answer. (5 pts) 6) What was the sales revenue per unit of "plums" in the east" location in "2017"? Answer to 2 decimal places. Include the Pivot Table you used to find this answer. (5 pts) 7) in 2019", what percent of "cereal" group units were sold at each of the locations? Answer to 2 decimal places include the Pivot Table you used to find this answer. (5 pts) 8) Create a 2-D column pivot chart to show total sales revenue by month for each location Month should be on the horizontal axis, and sales revenue on the vertical axis Format the chart to include (5 pts) A chart title, centered above the chart A horizontal and vertical axis title A legend and data table on the bottom (below the chart). Only January, March, May, July, September and November (with each month being shown only once on the horizontal) 9) if you look at trends for the product groups (fruit cereal, etc) for all locations combined by year, which group(s) are showing increasing yearly sales revenue and which group(s) are showing decreasing yearly sales revenue. Be sure to include data talves, pivot charts, pivot tables or other evidence to support your answer (5 points) 10) Which one of the locations do you think is doing best for 2018, and why do you think so? Be sure to include data tables pivot charts, pivot tables or other evidence to support your answer. (5 points) . . Questions 4-10 Busters is a grocery store chain in Hortonville. There are four locations in the city, denoted by their location. Lori the owner of Busters, has compiled some data about sales of certain products and given you the data to perform some analysis on it. The file contains the following variables for each product The year and month for the sales for the product The store the sales are for (denoted by their location in Hortonville) The group the product is in The product How many units were sold The sales revenue (Total, not per unit) 4) What is the total sales revenue of Special K" for all locations together? Answer to 0 decimal places include the Pivot Table you used to find this answer. (5 pts) . . 5) What was the total sales (units) of the "fruit" group in the south" location? Answer to 0 decimal places include the Pivot Table you used to find this answer. (5 pts) 6) What was the sales revenue per unit of "plums" in the east" location in "2017"? Answer to 2 decimal places. Include the Pivot Table you used to find this answer. (5 pts) 7) in 2019", what percent of "cereal" group units were sold at each of the locations? Answer to 2 decimal places include the Pivot Table you used to find this answer. (5 pts) 8) Create a 2-D column pivot chart to show total sales revenue by month for each location Month should be on the horizontal axis, and sales revenue on the vertical axis Format the chart to include (5 pts) A chart title, centered above the chart A horizontal and vertical axis title A legend and data table on the bottom (below the chart). Only January, March, May, July, September and November (with each month being shown only once on the horizontal) 9) if you look at trends for the product groups (fruit cereal, etc) for all locations combined by year, which group(s) are showing increasing yearly sales revenue and which group(s) are showing decreasing yearly sales revenue. Be sure to include data talves, pivot charts, pivot tables or other evidence to support your answer (5 points) 10) Which one of the locations do you think is doing best for 2018, and why do you think so? Be sure to include data tables pivot charts, pivot tables or other evidence to support your answer. (5 points)