Please answer the following questions down below , I only have 25-30 mins to do so.
1.25, 1.34, 2.31, 2.42, 2.52
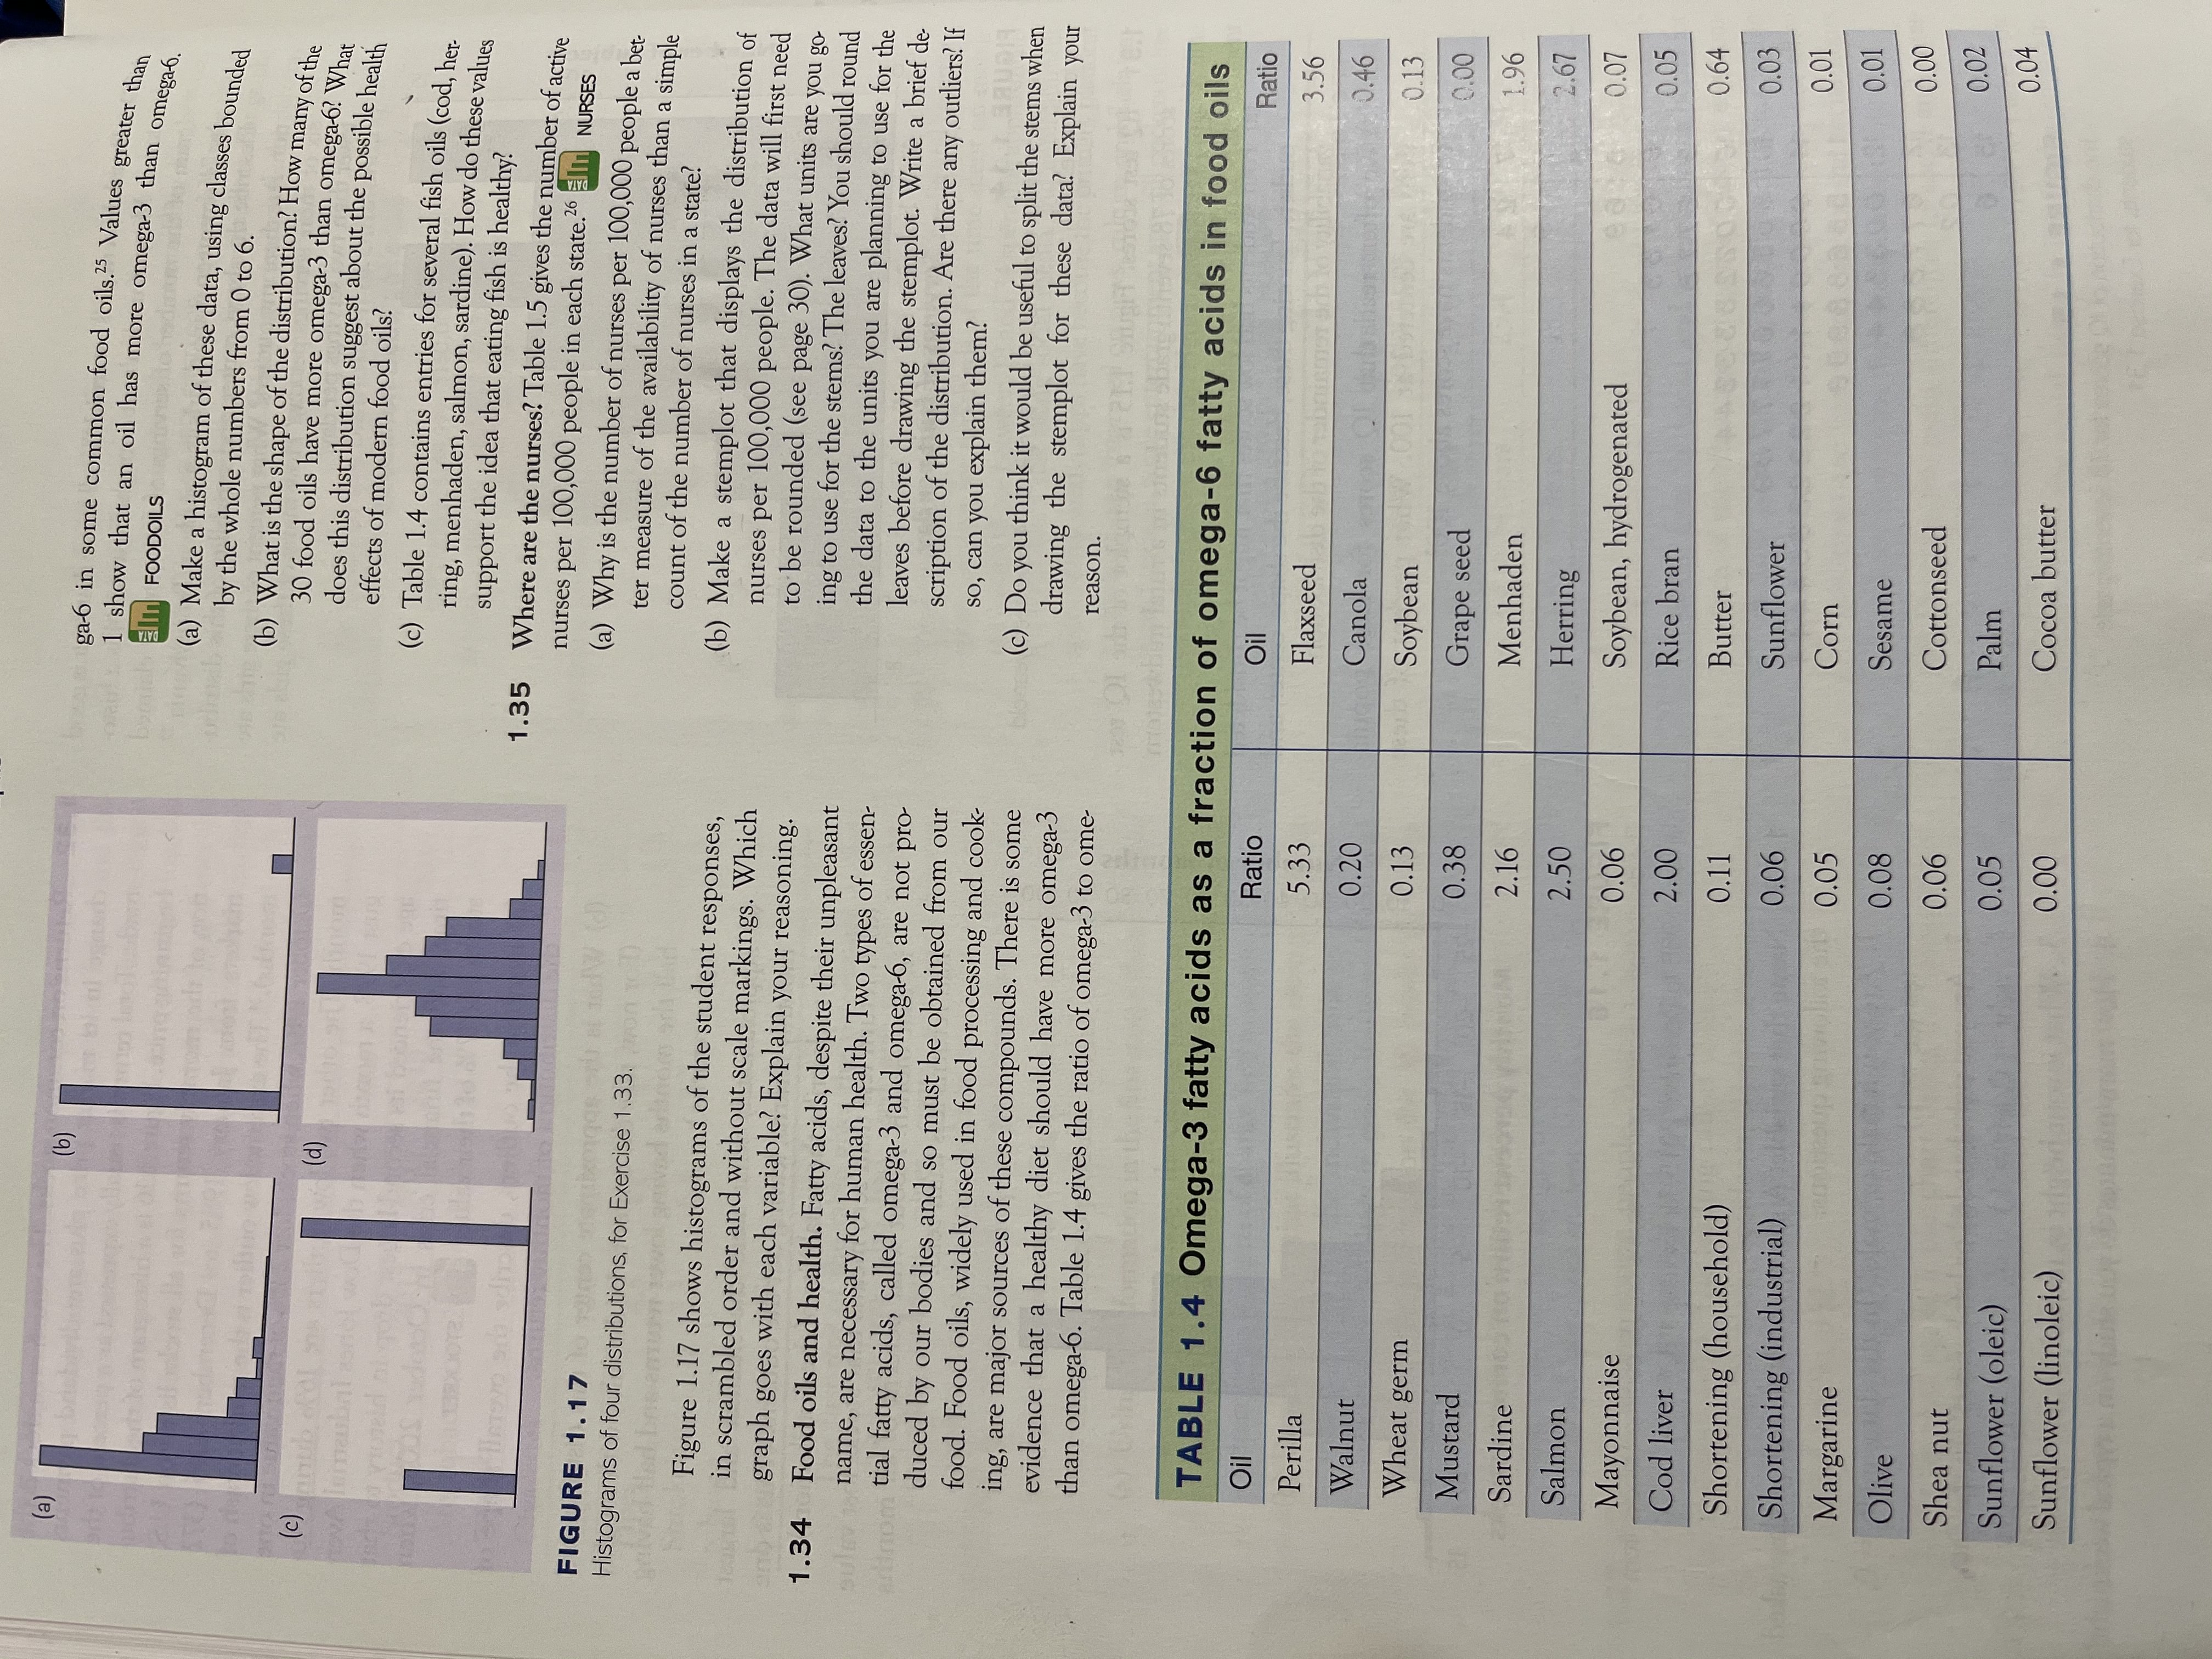
(b) ga-6 in some common food oils.'s Values greater than 1 show that an oil has more omega-3 than omegaf. all FOODOILS (a) Make a histogram of these data, using classes bounded by the whole numbers from 0 to 6. (c) b) What is the shape of the distribution? How many of the anub ofol (d) 30 food oils have more omega-3 than omega-6? What vineubala does this distribution suggest about the possible health effects of modern food oils? (c) Table 1.4 contains entries for several fish oils (cod, her- ring, menhaden, salmon, sardine). How do these values support the idea that eating fish is healthy? 1.35 Where are the nurses? Table 1.5 gives the number of active FIGURE 1.17 nurses per 100,000 people in each state.26 all NURSES Histograms of four distributions, for Exercise 1.33. (a) Why is the number of nurses per 100,000 people a bet ter measure of the availability of nurses than a simple count of the number of nurses in a state? Figure 1.17 shows histograms of the student responses, in scrambled order and without scale markings. Which (b) Make a stemplot that displays the distribution of graph goes with each variable? Explain your reasoning. nurses per 100,000 people. The data will first need to be rounded (see page 30). What units are you go- 1.34 Food oils and health. Fatty acids, despite their unpleasant ing to use for the stems? The leaves? You should round name, are necessary for human health. Two types of essen- the data to the units you are planning to use for the tial fatty acids, called omega-3 and omega-6, are not pro- leaves before drawing the stemplot. Write a brief de duced by our bodies and so must be obtained from our scription of the distribution. Are there any outliers? If food. Food oils, widely used in food processing and cook- so, can you explain them? ing, are major sources of these compounds. There is some (c) Do you think it would be useful to split the stems when evidence that a healthy diet should have more omega-3 drawing the stemplot for these data? Explain your than omega-6. Table 1.4 gives the ratio of omega-3 to ome- reason. TABLE 1.4 Omega-3 fatty acids as a fraction of omega-6 fatty acids in food oils Oil Ratio Oil Ratio Perilla 5.33 Flaxseed 3.56 Walnut 0.20 Canola 0.46 Wheat germ 0.13 Soybean 0.13 Mustard 0.38 Grape seed 0.00 Sardine 2.16 Menhaden 1.96 Salmon 2.50 Herring 2.67 Mayonnaise 0.06 Soybean, hydrogenated 0.07 Cod liver 2.00 Rice bran 0.05 Shortening (household) 0.11 Butter 0.64 Shortening (industrial) 0.06 Sunflower 0.03 Margarine 0.05 Corn 0.01 Sesame 0.01 Olive 0.08 0.0 Shea nut 0.06 Cottonseed 0.02 Sunflower (oleic) 0.05 Palm 0.04 Sunflower (linoleic) 0.00 Cocoa butter1.20 The shape of the distribution in Exercise 1.19 is (a) skewed to the left. (b) skewed upward. (c) skewed to the right. 1.21 The state with the smallest percent of first-year students en- 0 012 23 4 rolled in the state has (a) 0.34% enrolled. 2 2 24 4 4 5 6 6 6 6 7 78 89 (b) 3.4% enrolled. 0 012 23 (c) 34% enrolled. 5 5 7 789 1.22 You look at real estate ads for houses in Naples, Florida. 0 0 1 23 34 There are many houses ranging from $200,000 to $500,000 in price. The few houses on the water, however, have prices up to $15 million. The distribution of house The midpoint of this distribution is prices will be (a) 60%. (a) skewed to the left. (b) 76%. (b) roughly symmetric. (c) 80%. (c) skewed to the right. 0.1 CHAPTER 1 EXERCISES 1.23 Medical students. Students who have finished medical Haird school are assigned to residencies in hospitals to receive Jubo and both the freezer and refrigerator net capacity in cu- bic feet. Which of these variables are categorical, and further training in a medical specialty. Here is part of which are quantitative? Give the units for the quantita- a hypothetical database of students seeking residency ive variables and the categories for the categorical vari- positions. USMLE is the student's score on Step 1 of ables. What are the individuals in the report? the national medical licensing examination. 1.25 What color is your car? The most popular colors for cars and light trucks vary with region, type of vehicle, Medical Specialty and over time. In North America, silver and gray are Name School Sex Age USMLE Sought the most popular choices for midsize cars, black and Abrams, Florida F 87 238 Family red for sports cars, and white for light trucks. Despite Laurie medicine this variation, overall white remains the top choice worldwide for the fifth consecutive year, increasing its Brown, Meharry M 25 205 Radiology lead by 7% over the previous year. Here is the distribu- Gordon tion of the top colors for vehicles sold globally in Cabrera, Tufts F 26 191 Pediatrics 2015:17 In CARCOLOR Maria Ismael, Indiana F 32 245 Internal Color Popularity Miranda medicine White 35% Black 17% (a) What individuals does this data set describe? Silver 12% (b) In addition to the student's name, how many vari- Gray 11% ables does the data set contain? Which of these vari- ables are categorical, and which are quantitative? If a Red 3% variable is quantitative, what units is it measured in? Beige, brown 8% 24 Buying a refrigerator. Consumer Reports will have an ar- Blue 7% ticle comparing refrigerators in the next issue. Some of Other colors the characteristics to be included in the report are the brand name and model; whether it has a top, bottom, or side-by-side freezer; the estimated energy consump Fill in the percent of vehicles that are in other colors. tion per year (kilowatts); whether or not it is Energy Make a graph to display the distribution of color Star compliant; the width, depth, and height in inches; popularity.on in Exercise Exercis the information in the histogram to compute the The number of firstborn children to mo sum of the 74 observations, and then use this to com- over 50 years of age represent a negligib pute the mean. What is the relationship between the first births and are not included in the extreme high mean and median? Is this what you expected? (a) For comparison with other yea (c) In general, you cannot find the exact values of the countries, we prefer a histogram median, quartiles, or mean from the histogram. each age class rather than the co What is special about the histogram of the number of servings of fruit that allows you to do this? (b) How many babies were there? 2.31 Guinea pig survival times. Here are the survival times (c) Make a histogram of the distr in days of 72 guinea pigs after they were injected with cents on the vertical scale. Us infectious bacteria in a medical experiment." Survival describe the distribution of the have their first child. times, whether of machines under stress or cancer lo lo equote patients after treatment, usually have distributions that (d) What are the locations of the are skewed to the right. I GUINPIGS in the ordered list of all matern classes do the median and qua 43 45 56 56 57 58 66 67 73 74 79 2.33 More on Nintendo and lapar to the near- 80 80 81 81 81 82 83 83 84 88 89 91 Exercise 1.38 (page 42), you examine housands of 91 92 92 97 99 99 100 100 101 102 102 102 times to complete a virtual gall blad pounds. 103 104 107 108 109 113 114 118 121 123 126 128 with and without four weeks of Ni 137 138 139 144 145 147 156 162 174 178 179 184 to you The most common methods for for 191 198 211 214 243 249 329 380 403 511 522 598 groups use x and s to summarize the (a) Graph the distribution and describe its main fea- hid to (a) What kinds of distributions a x and s? Do you think these tures. Does it show the expected right-skew? appropriate in this case? (b) Which numerical summary would you choose for (b) In the control group, one su s and non these data? Calculate your chosen summary. How time by 229 seconds. How m does it reflect the skewness of the distribution? observation change x and s ilimosM 2.32 Maternal age at childbirth. How old are women when You will need to compute they have their first child? Here is the distribution of mort rash group, both with and witho the age of the mother for all firstborn children in the United States in 2014:17 no bos(c) Compute the median for and without the high outlie about the resistance of the Age Count Age Count 2.34 Making resistance visible. In 10-14 years 2, 769 30-34 years 326,391 applet, place three observation 15-19 years 205,747 35-39 years 114,972 below it: two close together ne